What's new in ZeanDraw
Everything added since the last update. It is all live at zeanium.net/draw, and every picture and video here was taken from the real site. Click any picture to see it bigger.
Templates box
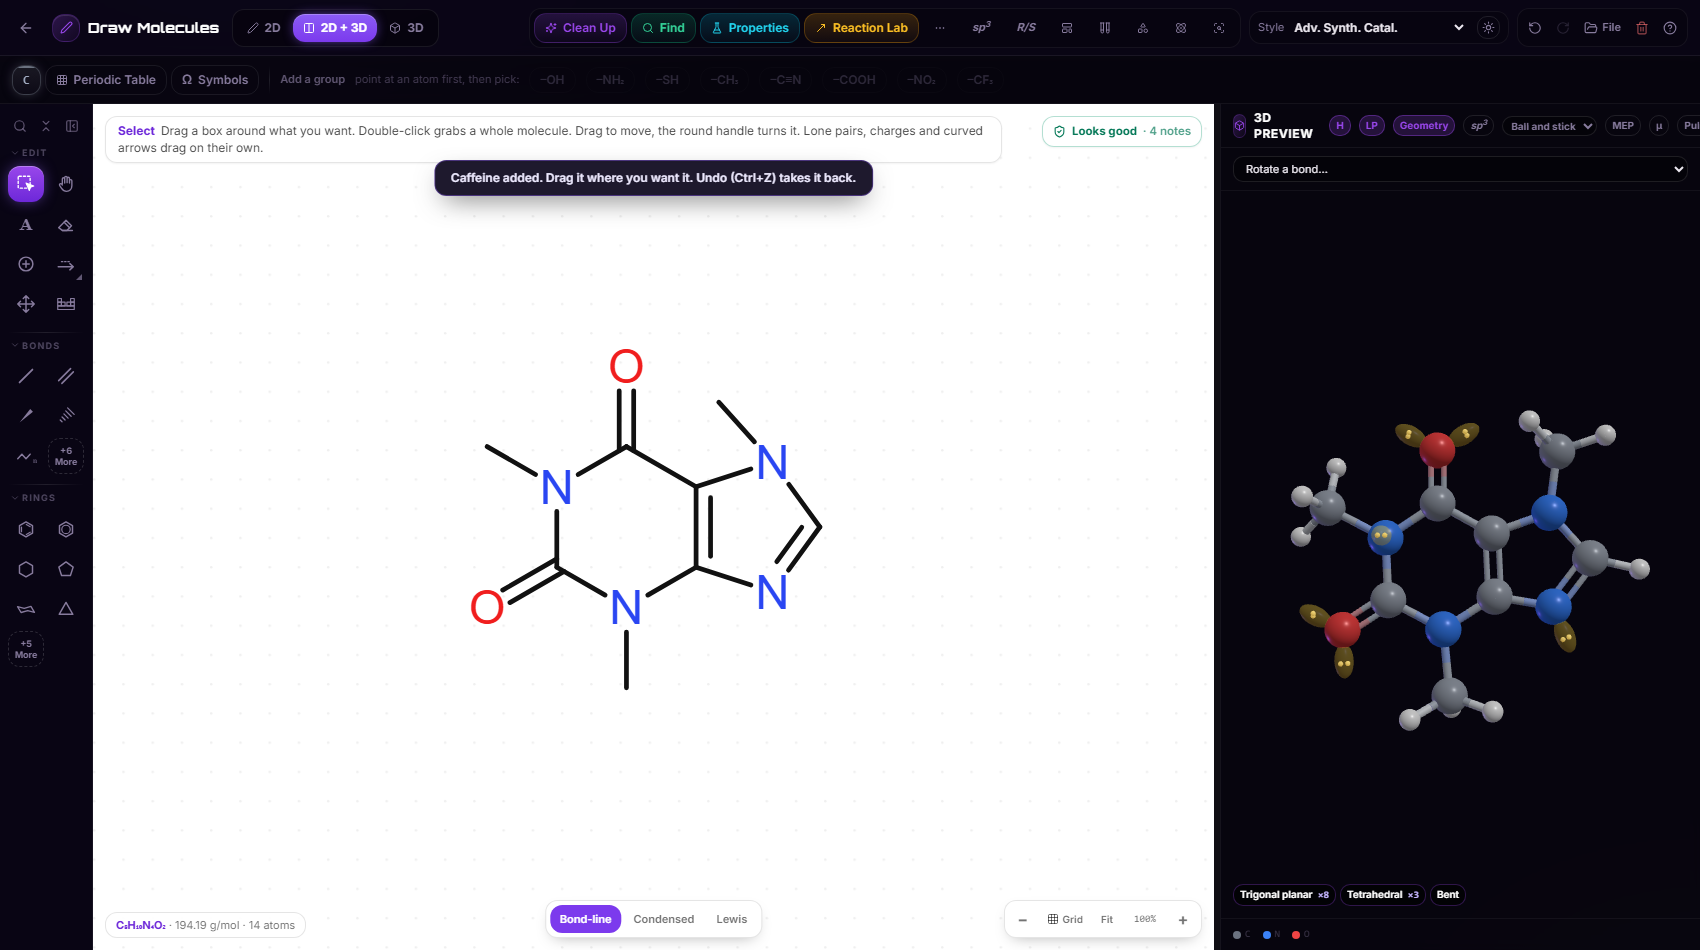
Ready-made structures and your own saved drawings in one place. Click one and it lands next to what you already drew, selected and ready to move. Ctrl+Z takes it back.
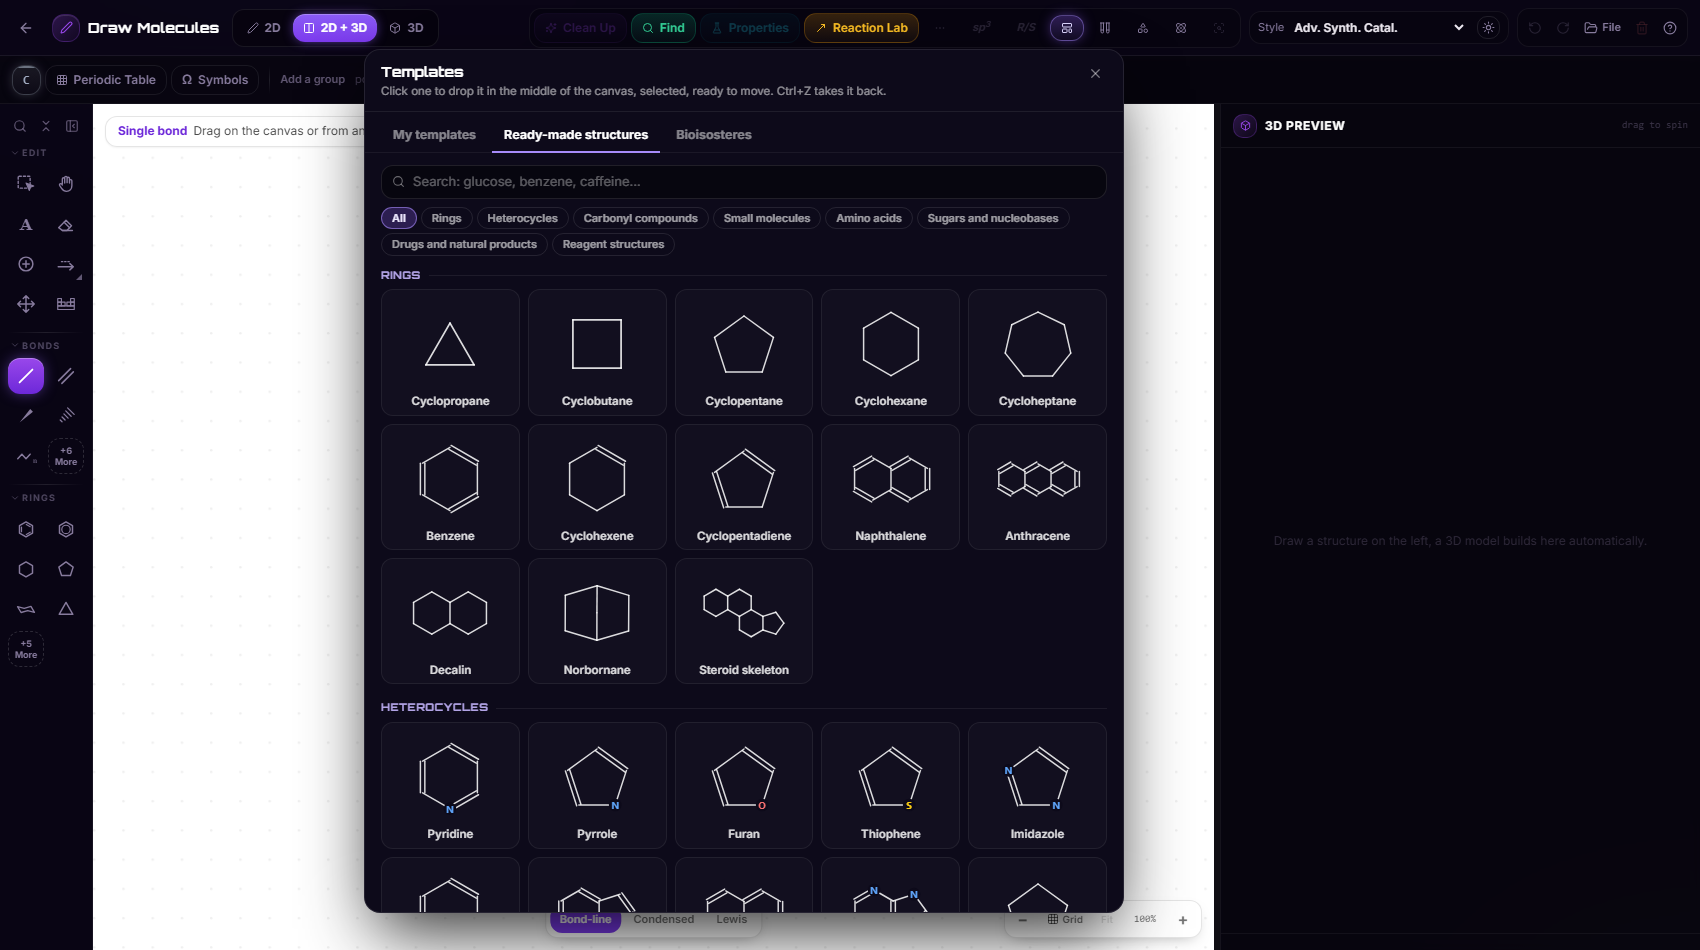
About 100 structures in 8 groups: rings, heterocycles, amino acids, sugars and bases, drugs, solvents, reagent structures.
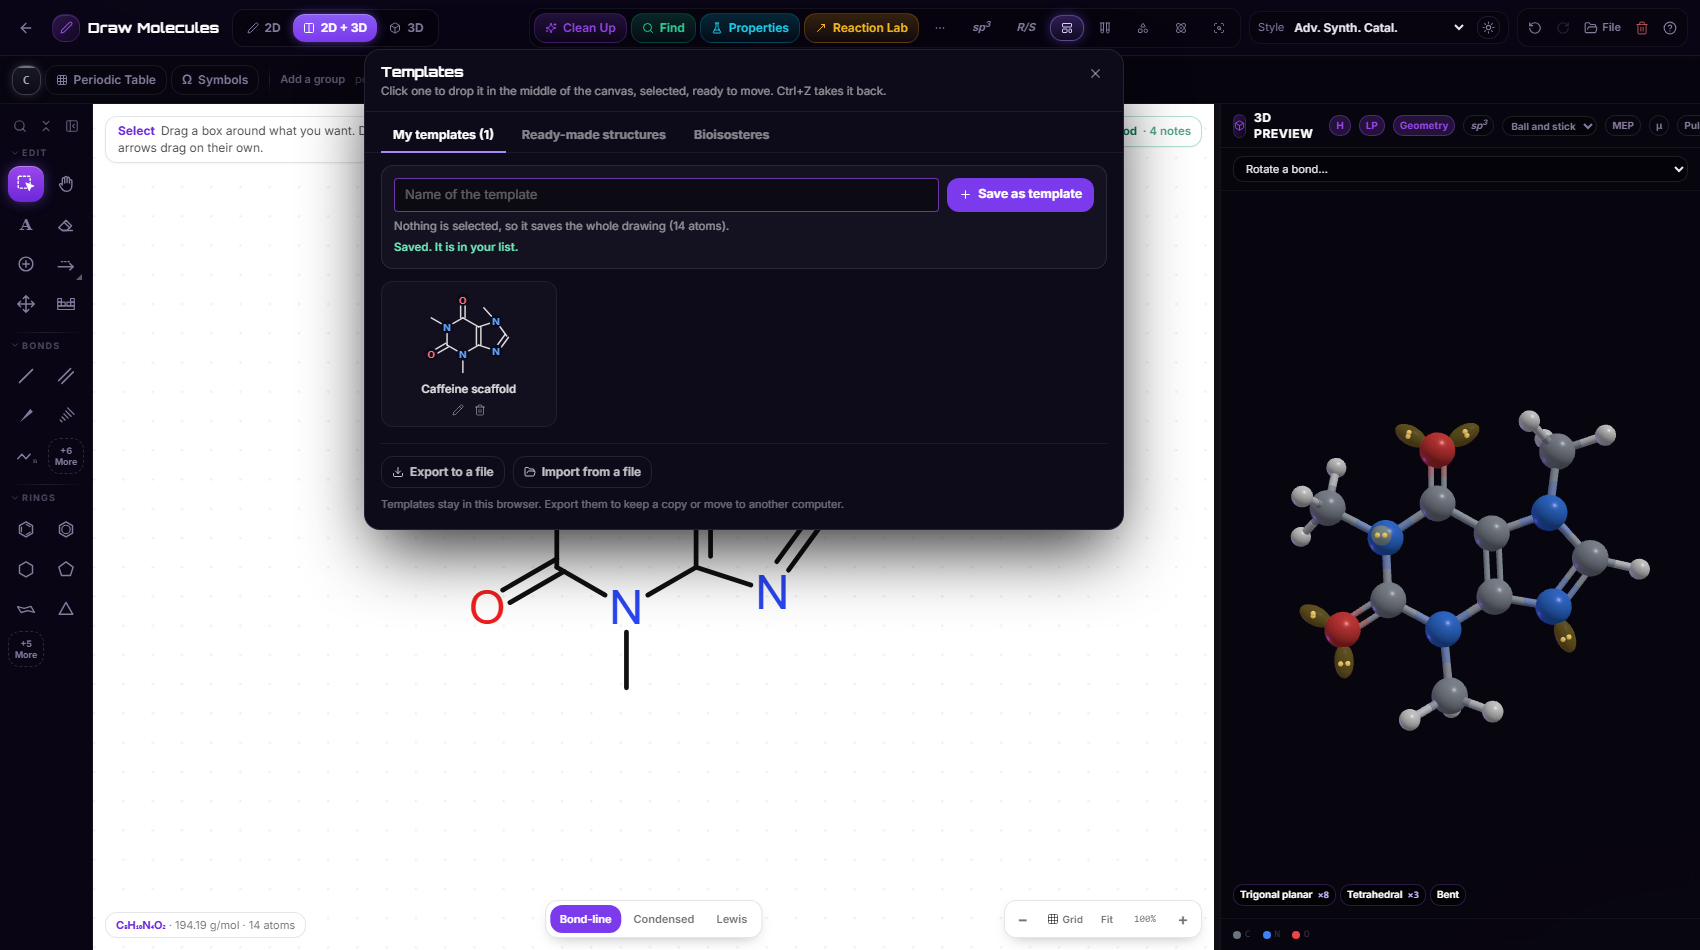
Save a selection (or the whole drawing) with a name. Rename, delete, export to a file and import on another computer.
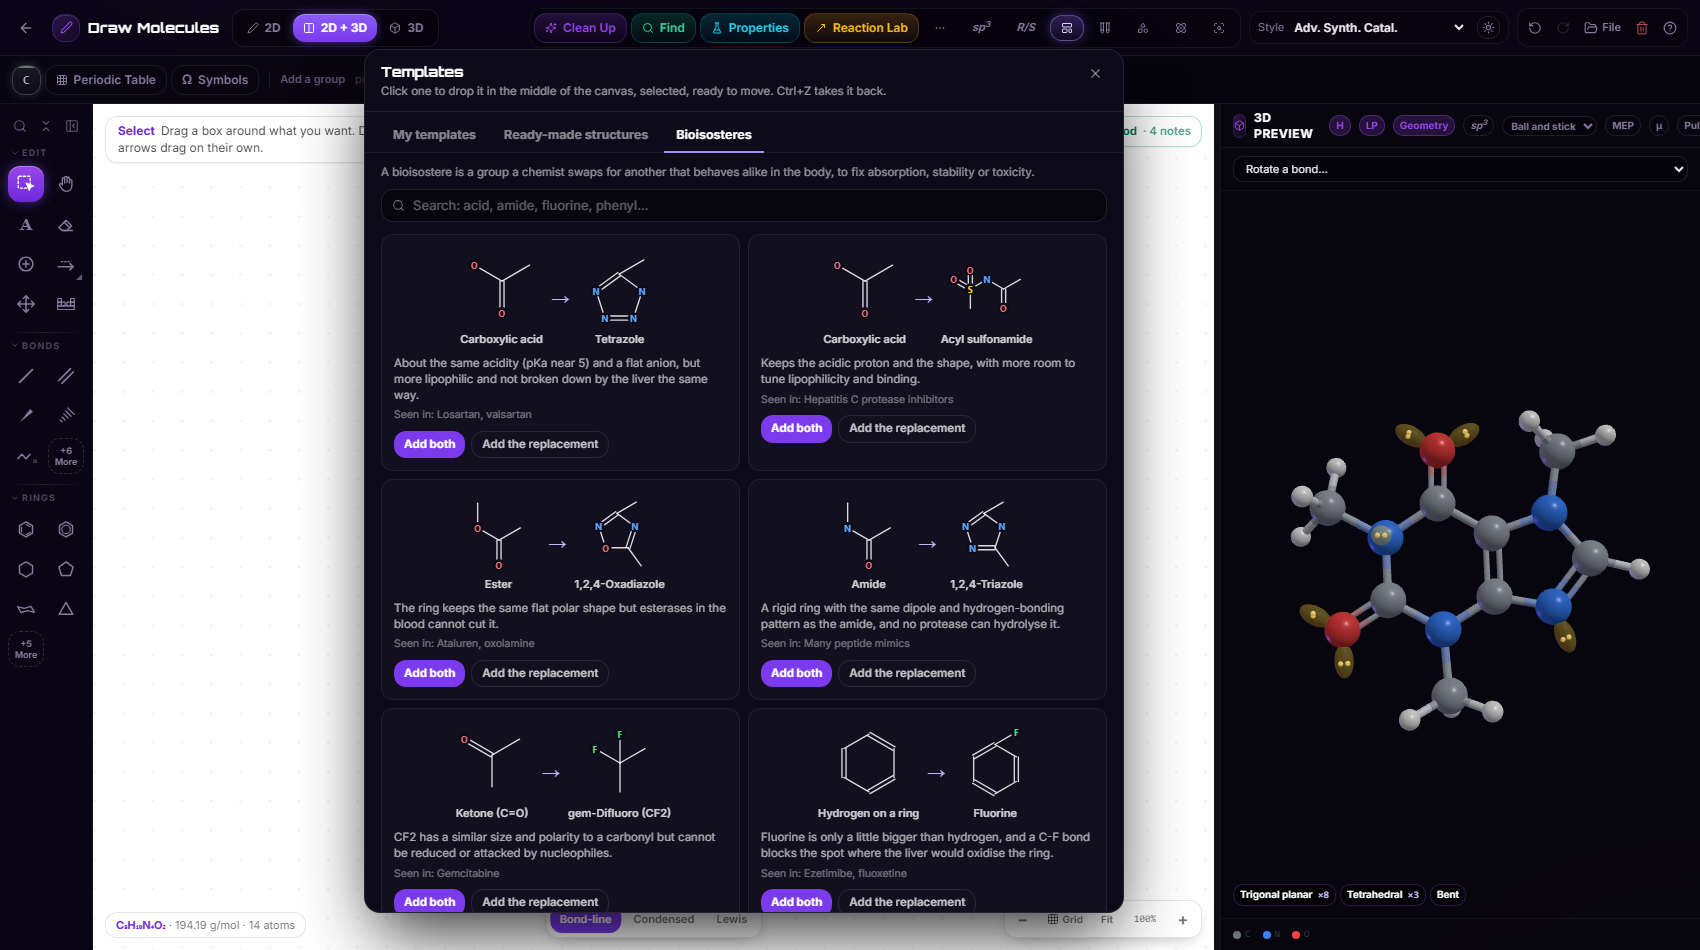
14 classic swaps (acid to tetrazole, H to F, phenyl to pyridine...), why chemists make them, and a drug where it was used. "Add both" draws the pair side by side.
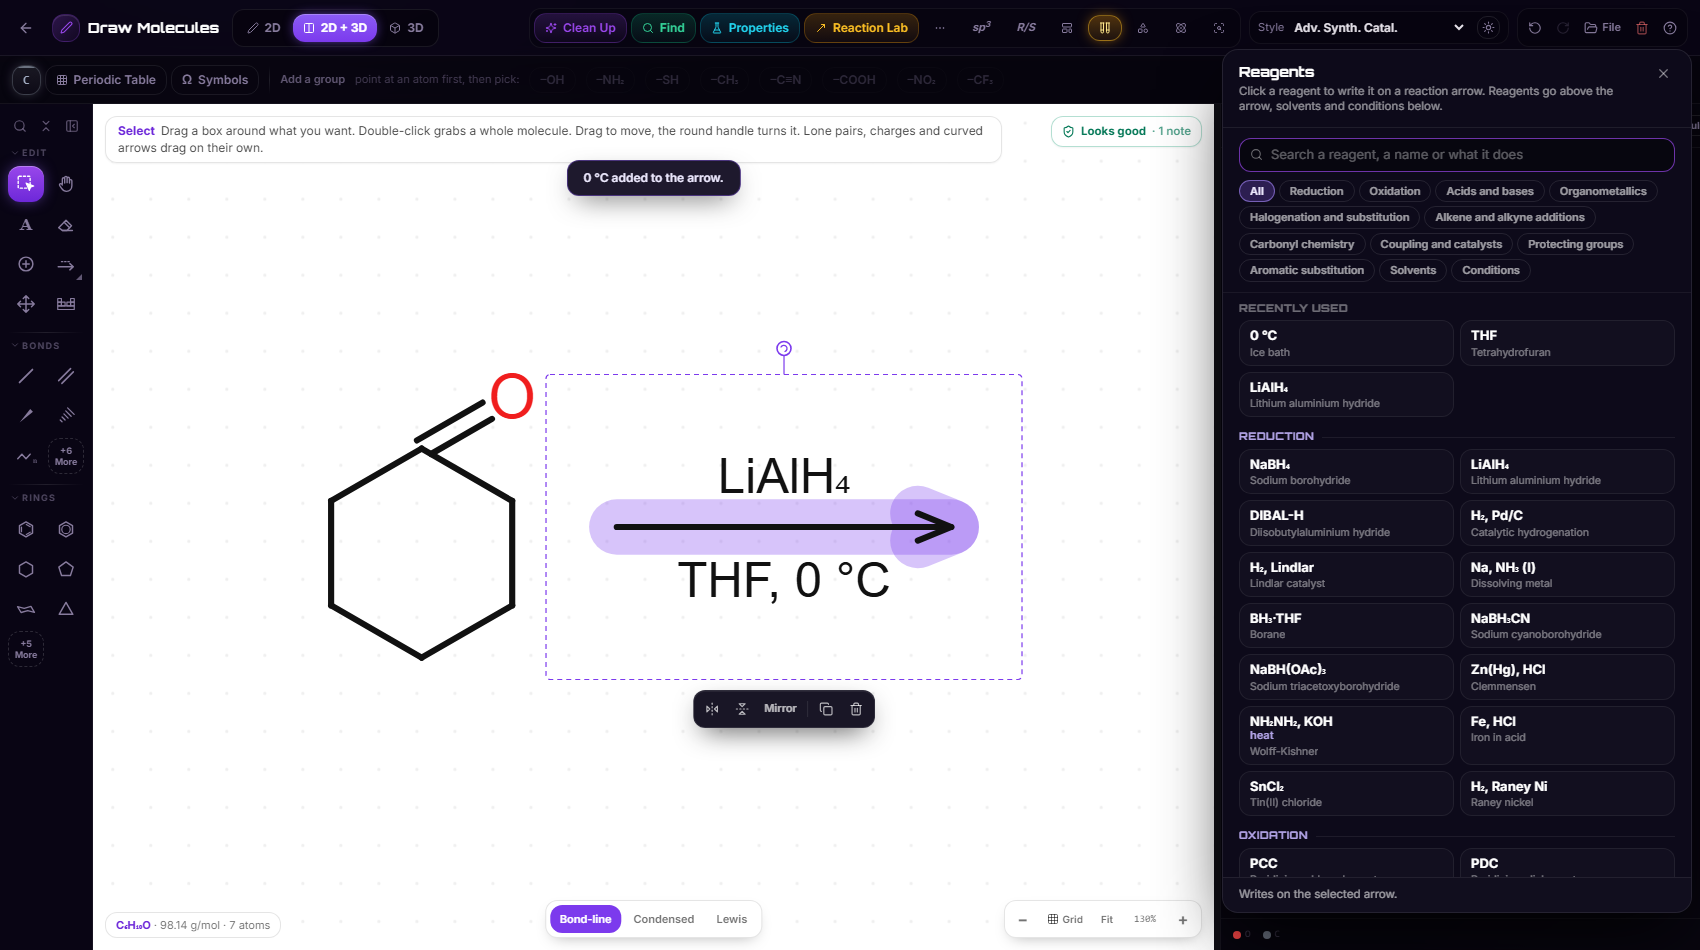
Reagents box
About 190 reagents, solvents and conditions in 11 groups, with search and recents. A click writes it on the reaction arrow: reagents above, solvents and conditions below. With no arrow yet, it draws one for you. Ready-made sequences like hydroboration fill both lines.
Analyze
One button, six ways to read a drawing. Each one marks the atoms and explains itself in a card, so it works as a check on your own reasoning.
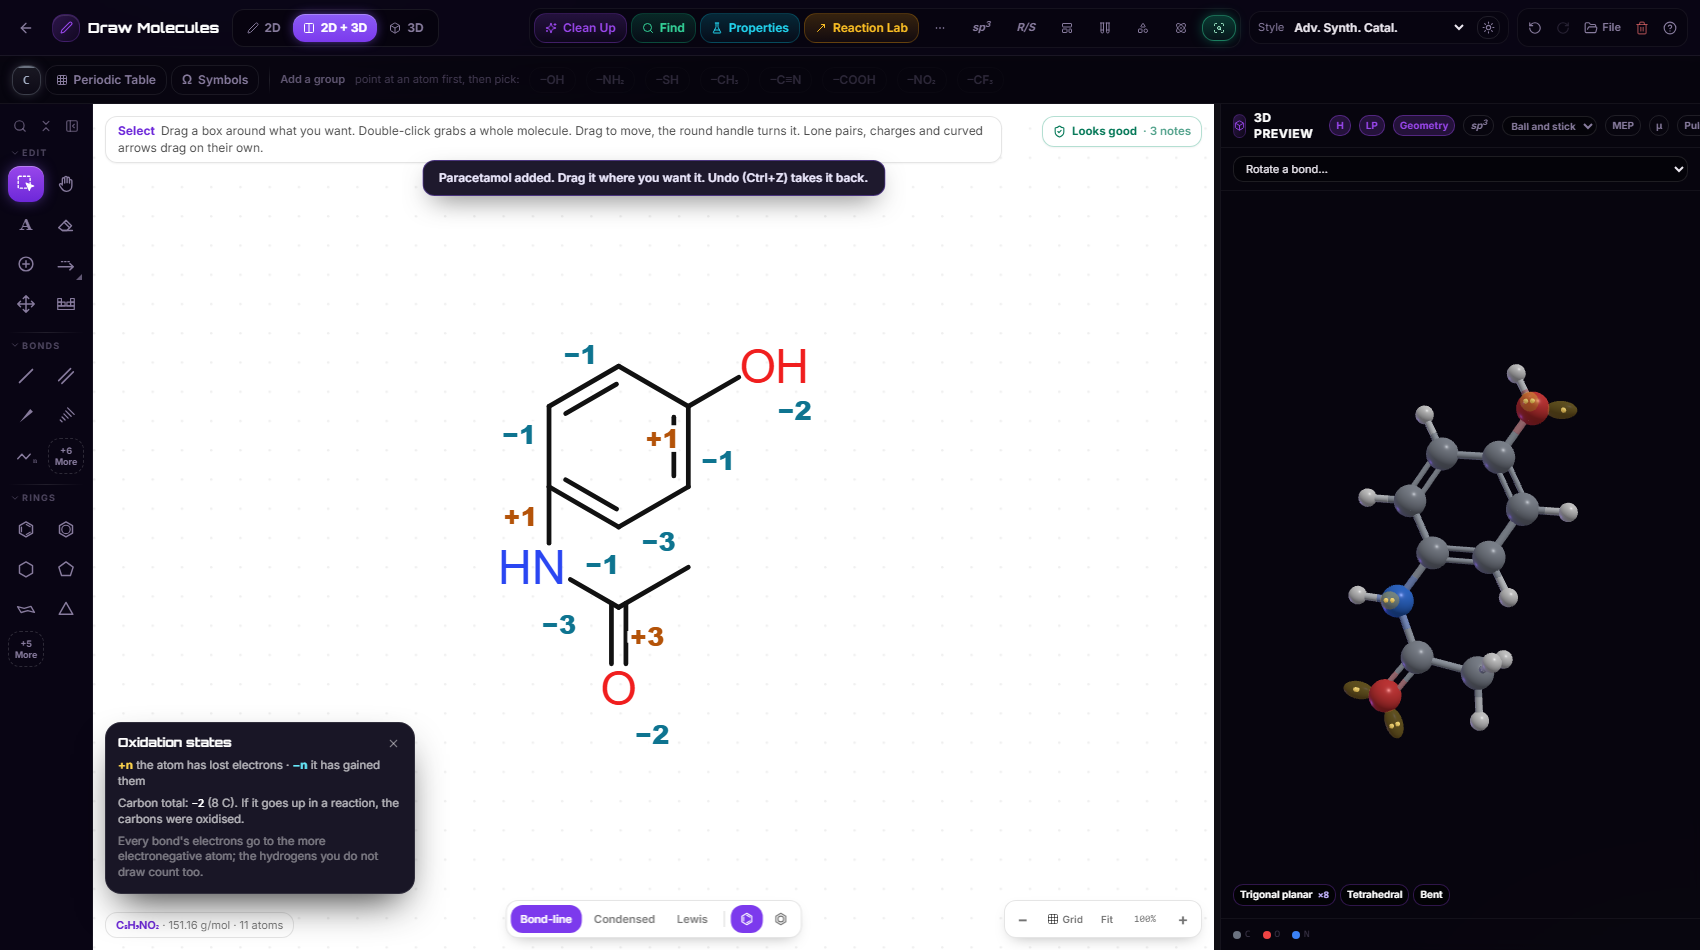
A number on every atom, hydrogens you do not draw included, and the carbon total. If the total goes up in a reaction, the carbons were oxidised.
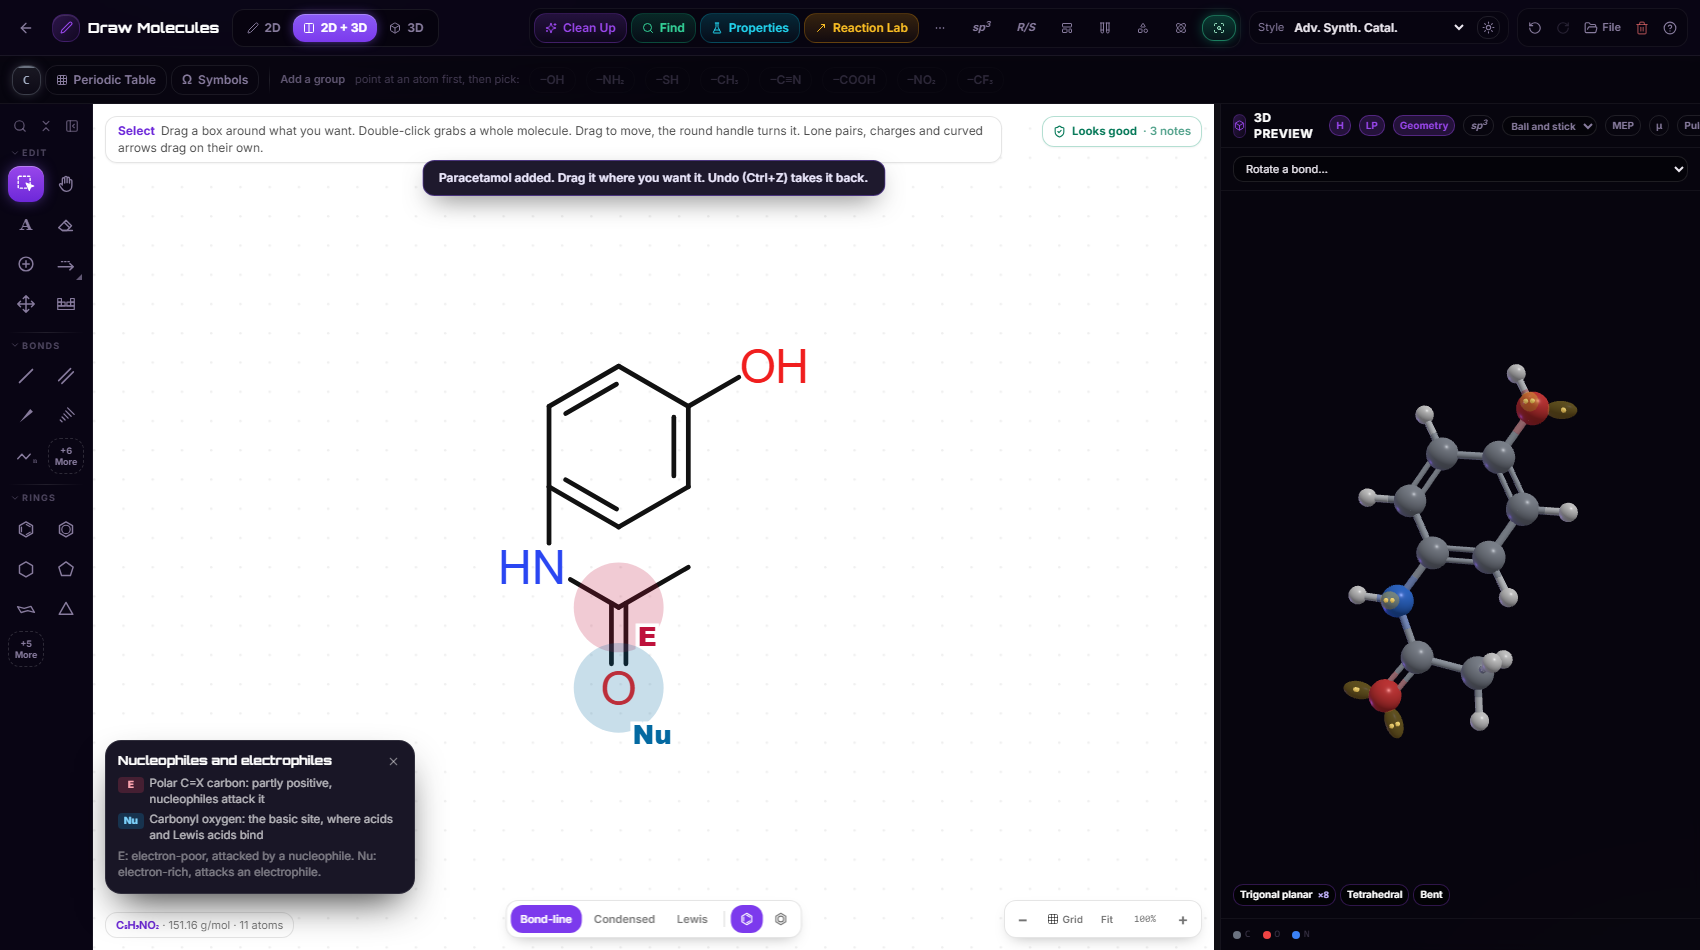
E and Nu badges, each with the reason (polar C=X carbon, carbonyl oxygen, alkyl halide, epoxide, enone...).
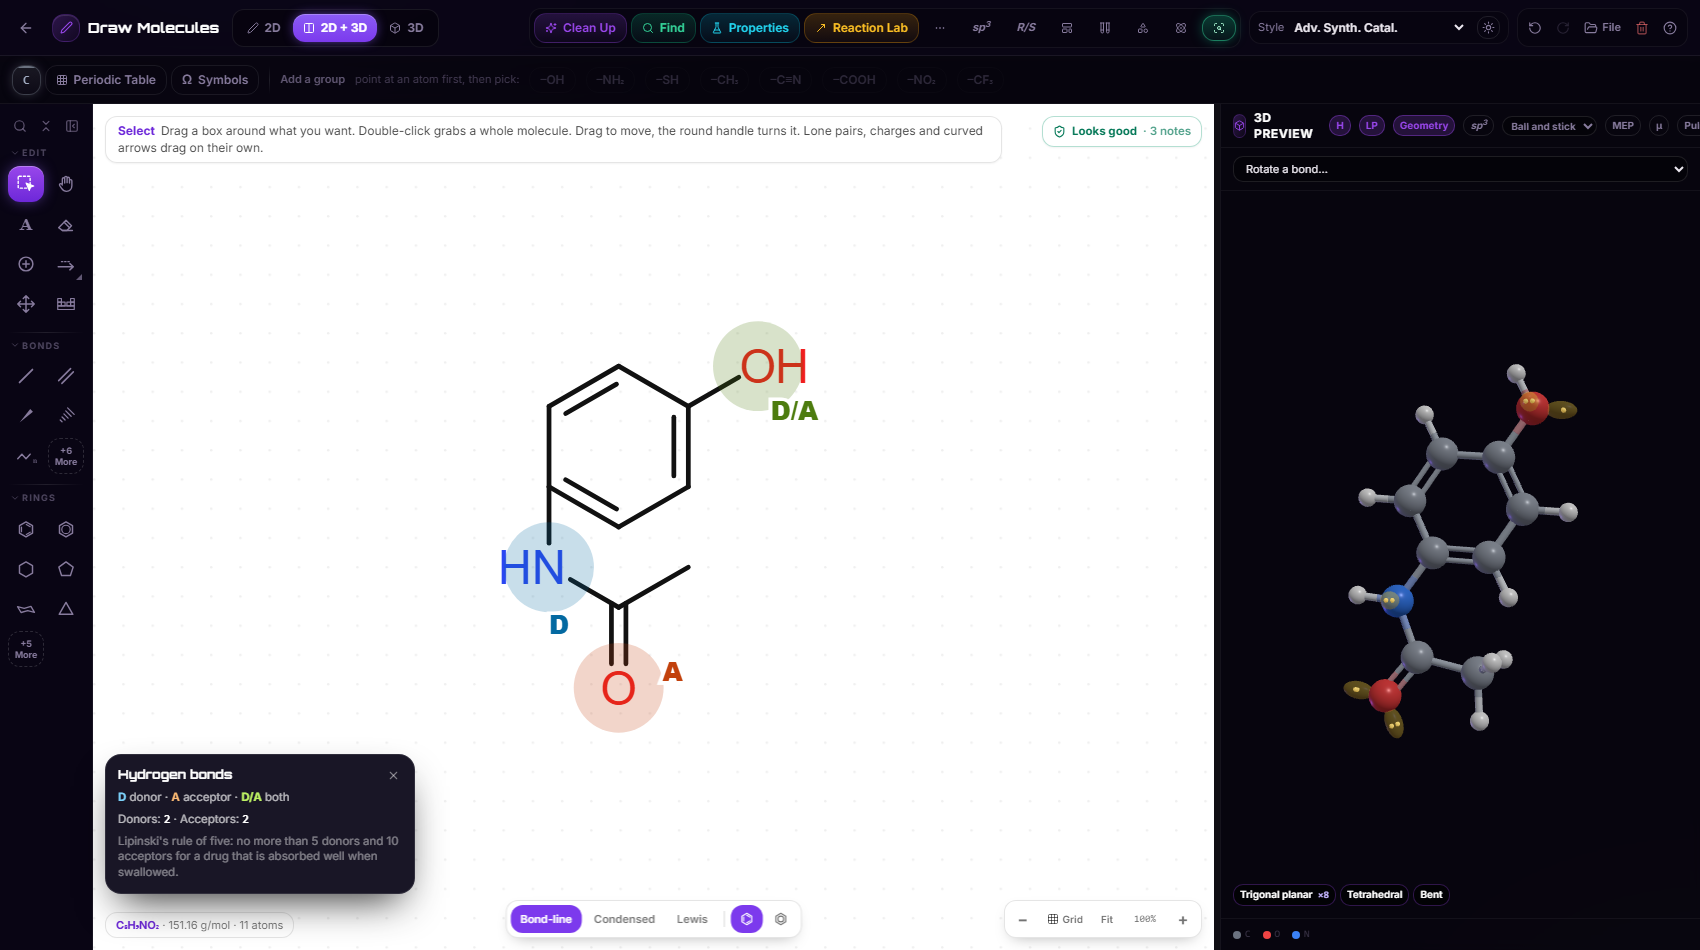
Donors (D), acceptors (A) and the Lipinski counts.
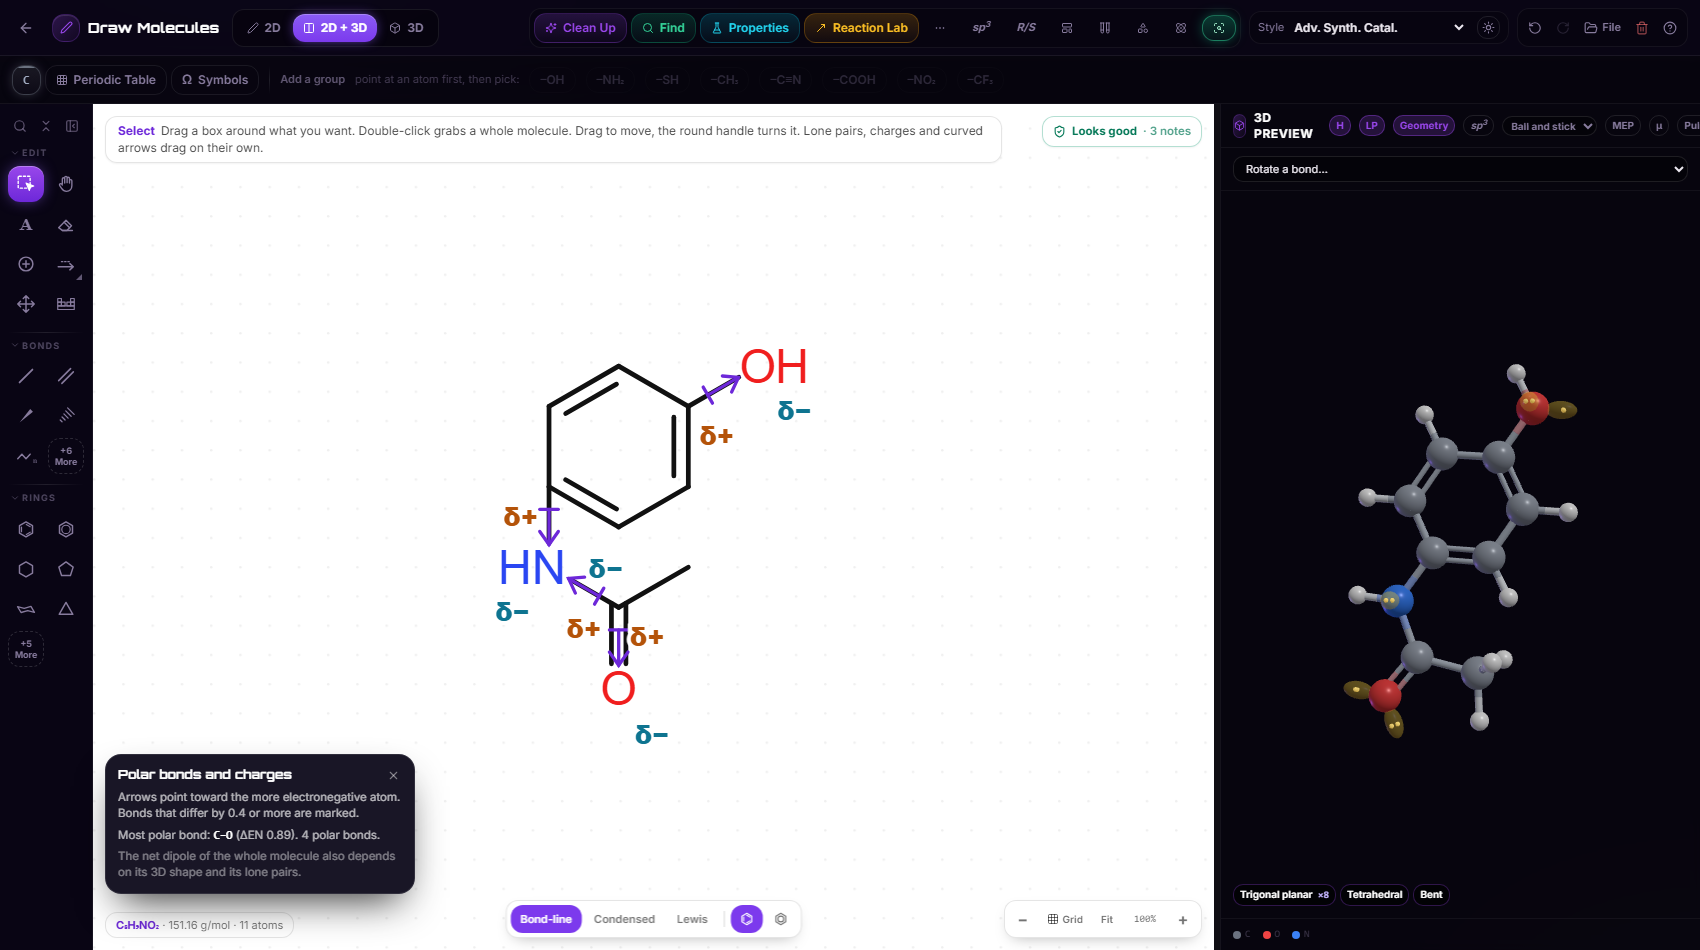
An arrow along each polar bond toward the more electronegative atom, with δ+ and δ−.
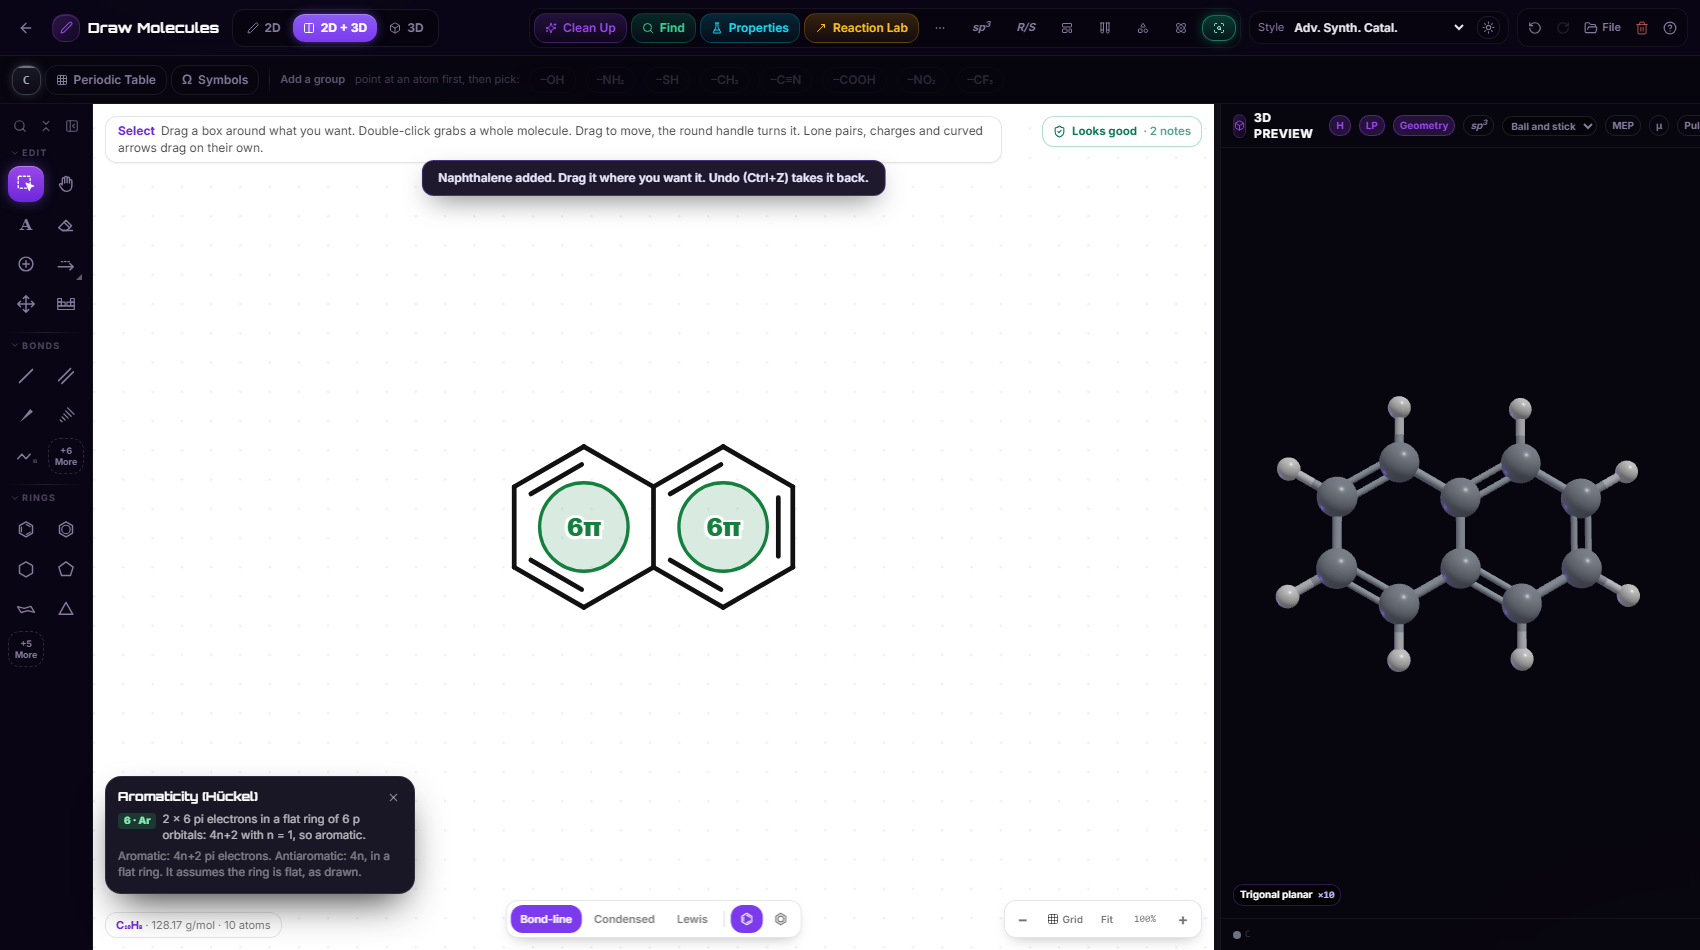
Every ring is aromatic, antiaromatic, nonaromatic or uncertain, with the electron count written out (4n+2, 4n, why a ring puckers).
Draw a reaction arrow and the oxidation-state card says what is oxidised, what is reduced and how many electrons move. It also lists any element whose atoms do not add up on both sides.
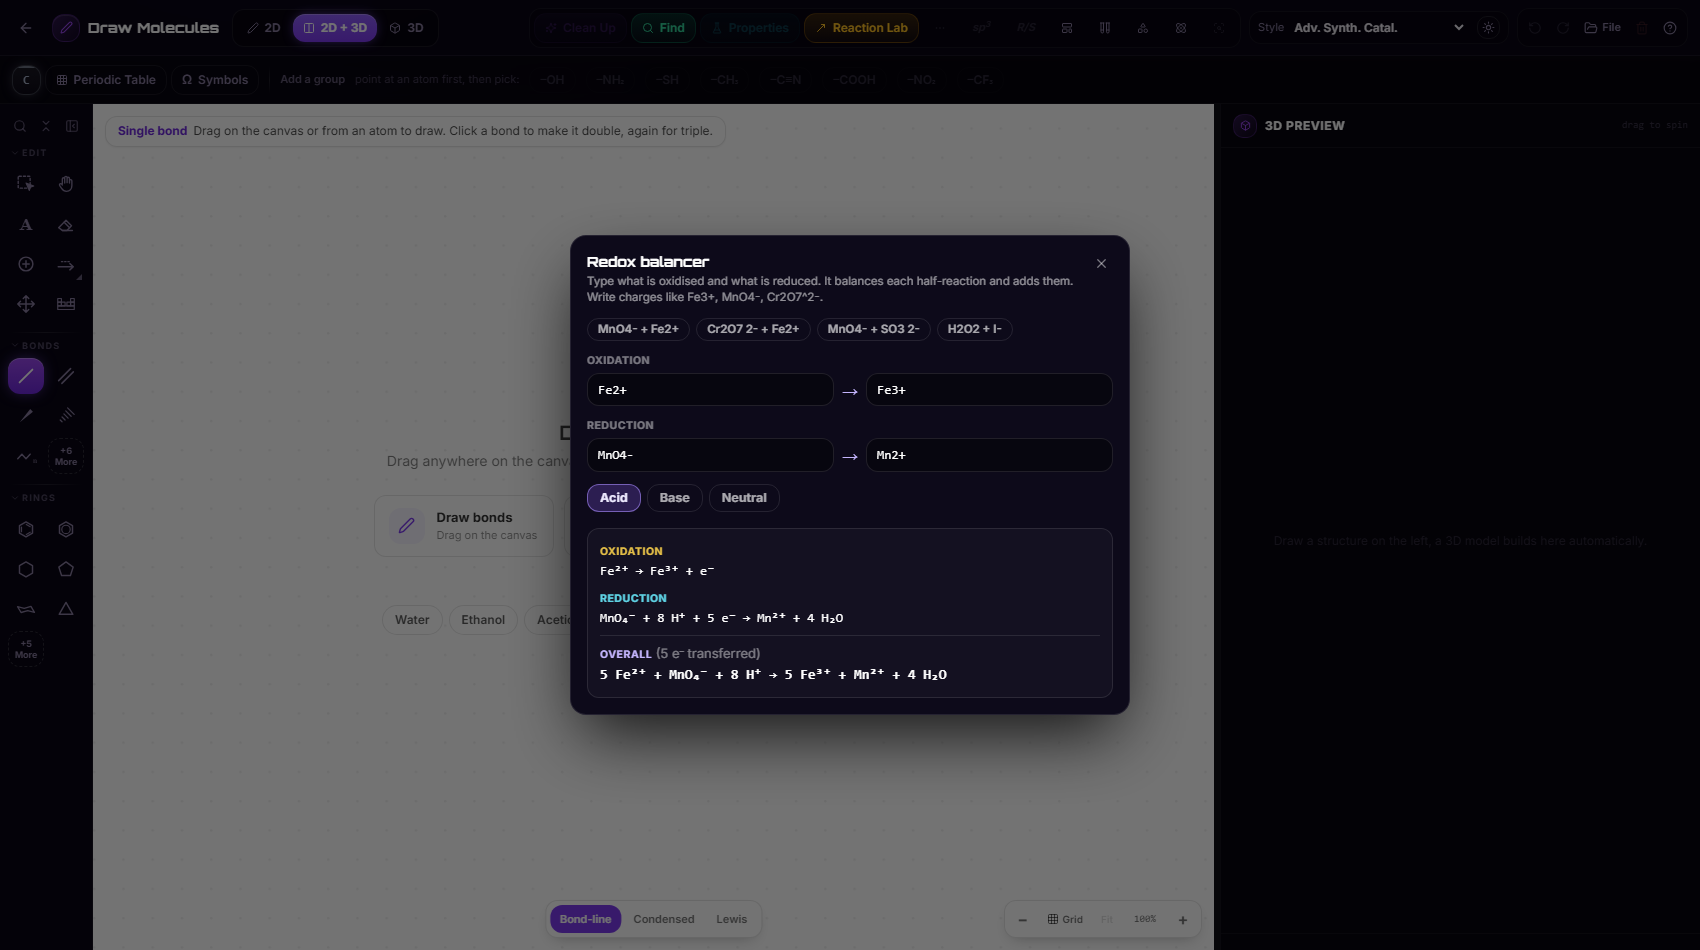
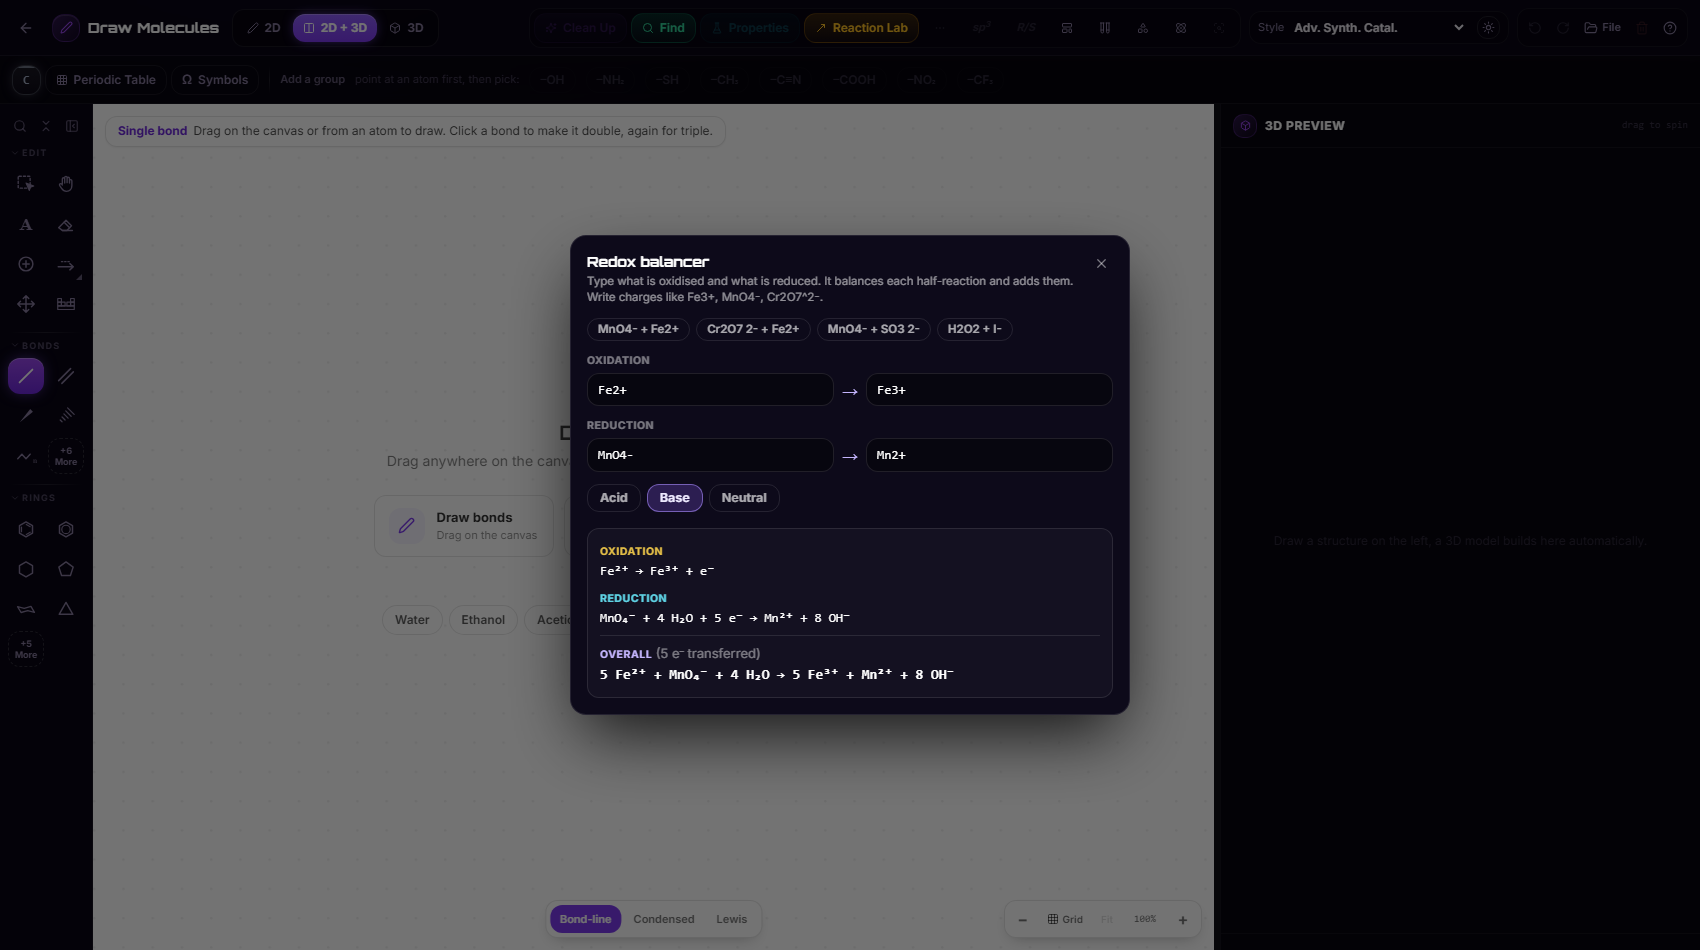
Redox balancer
Type what is oxidised and what is reduced, pick acid, base or neutral, and it balances each half-reaction and adds them up. Open it from Analyze, or press Ctrl+K and type "Redox".
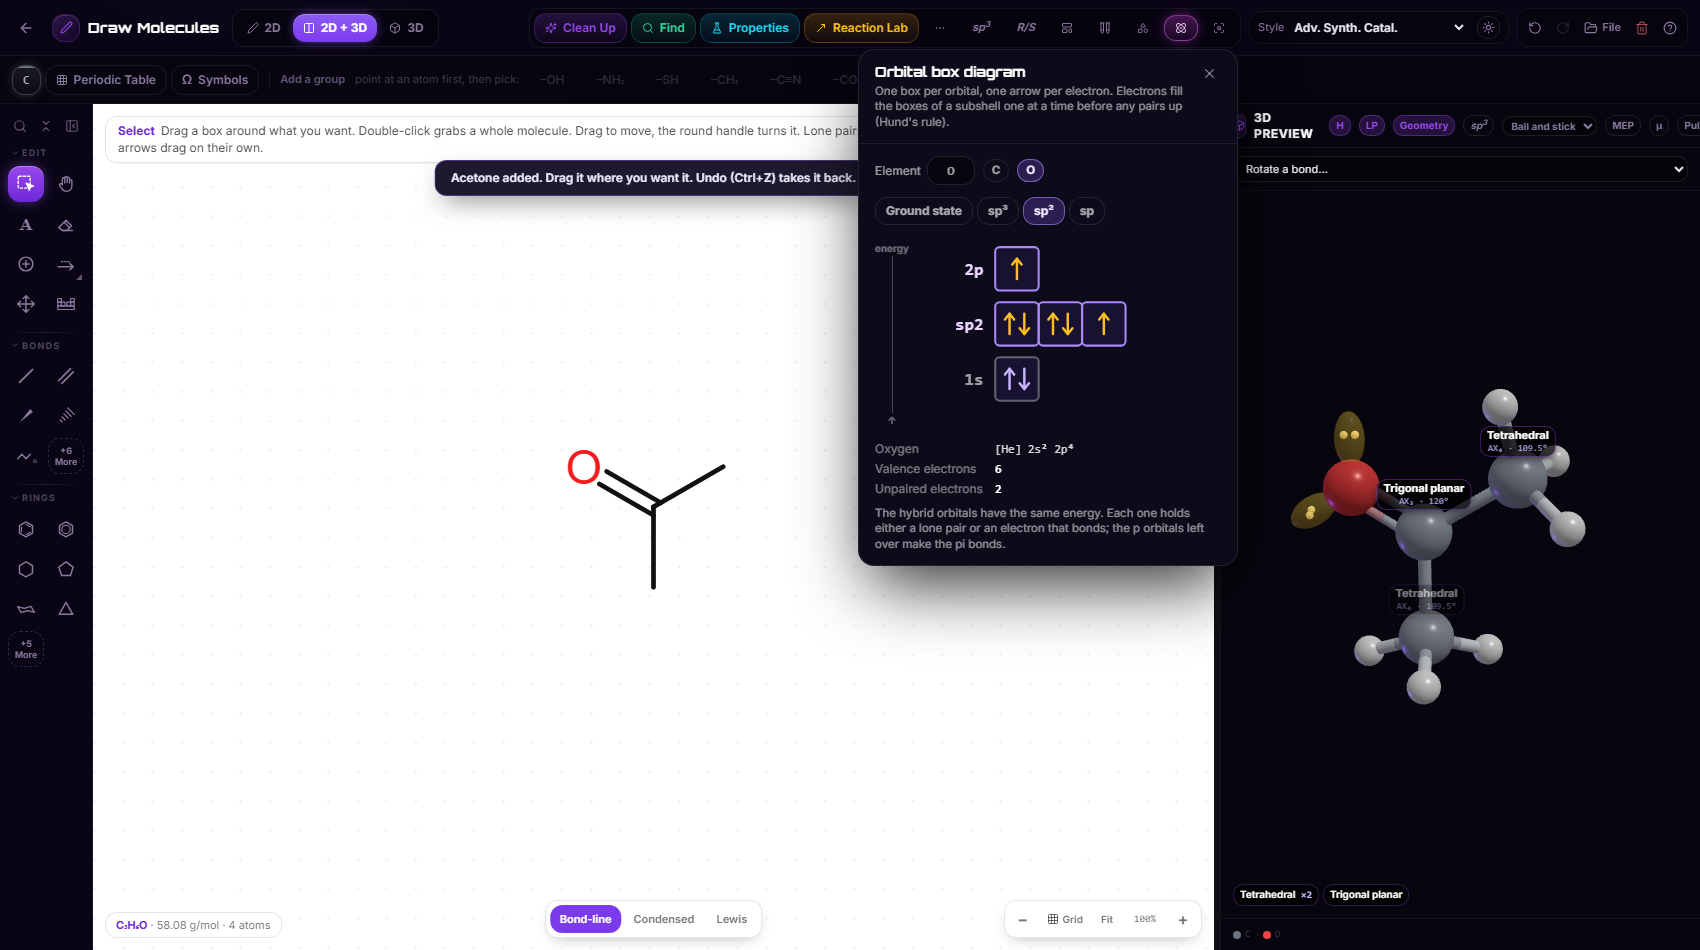
Orbital box
The electrons of any element in boxes, one arrow per electron, filled by Hund's rule. Switch to sp³, sp² or sp to see the hybrid orbitals with the lone pairs and the p orbitals left for pi bonds.
3D panel
Seven looks, an electrostatic map, a dipole arrow and a vibration viewer.
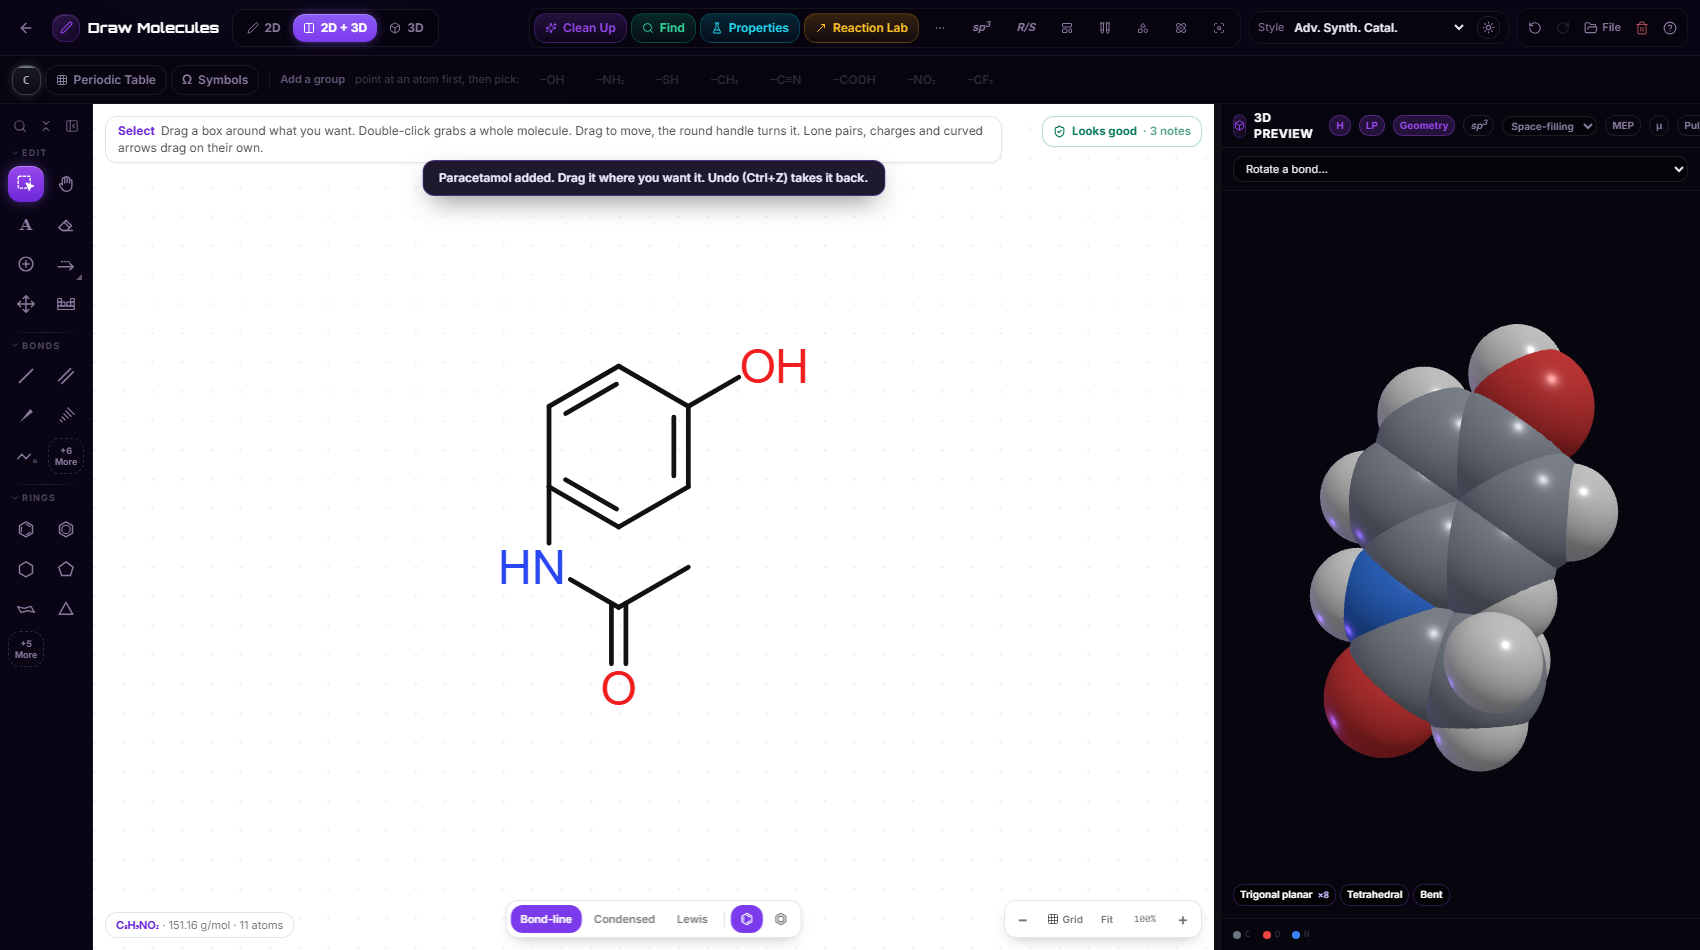
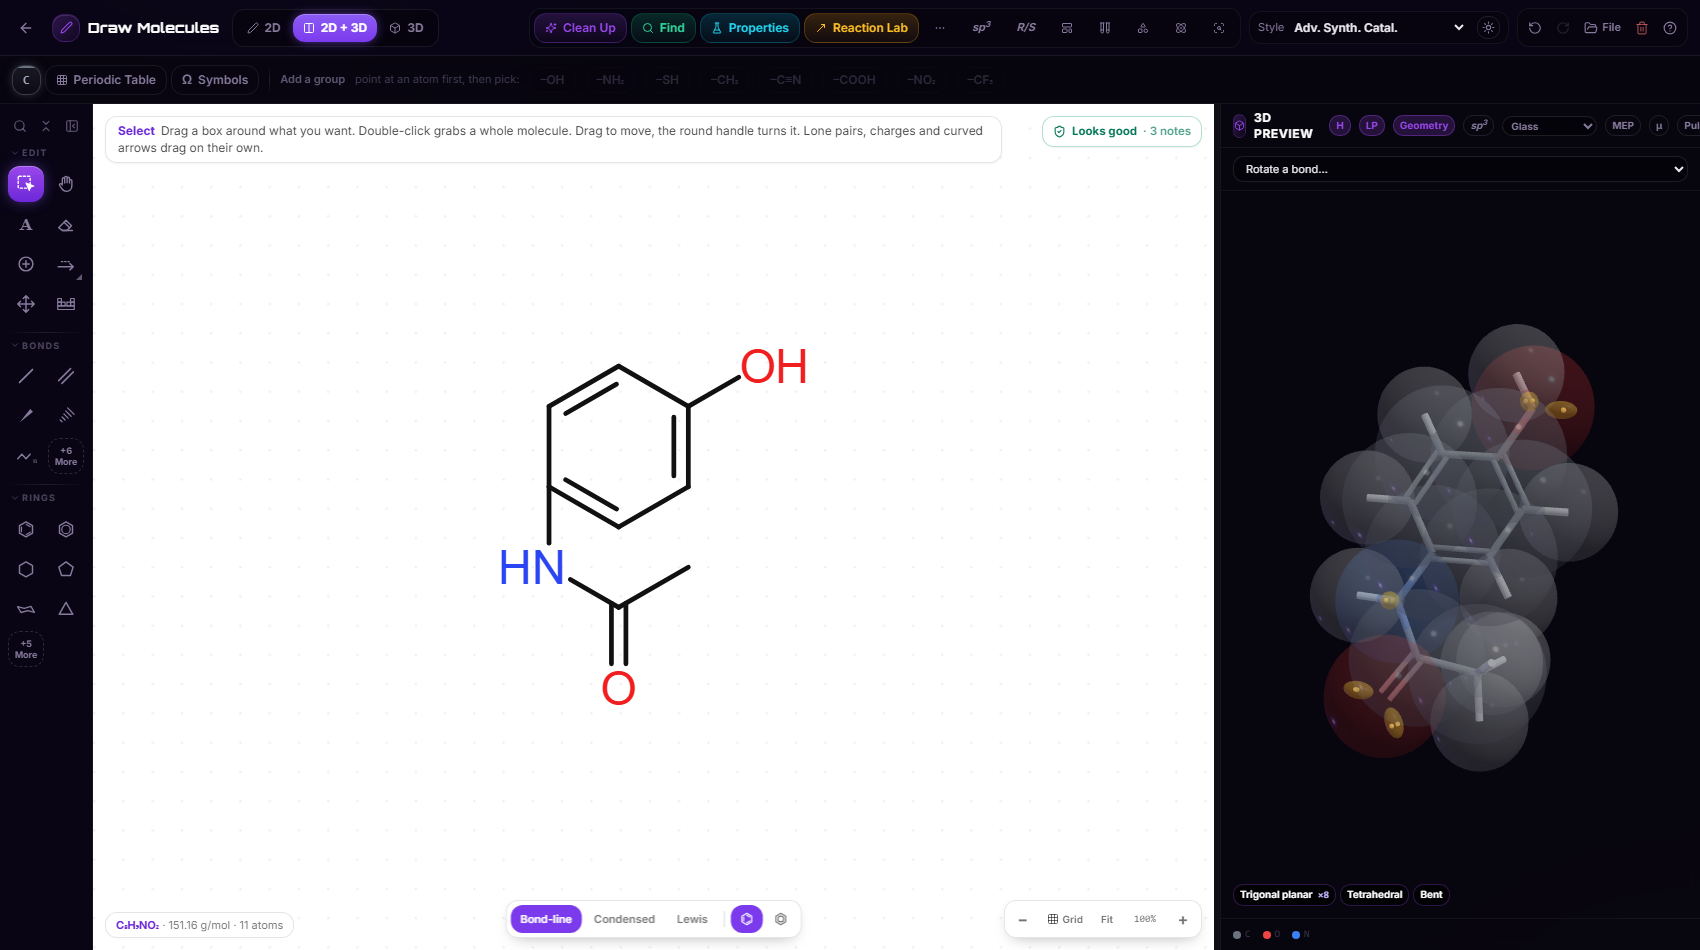
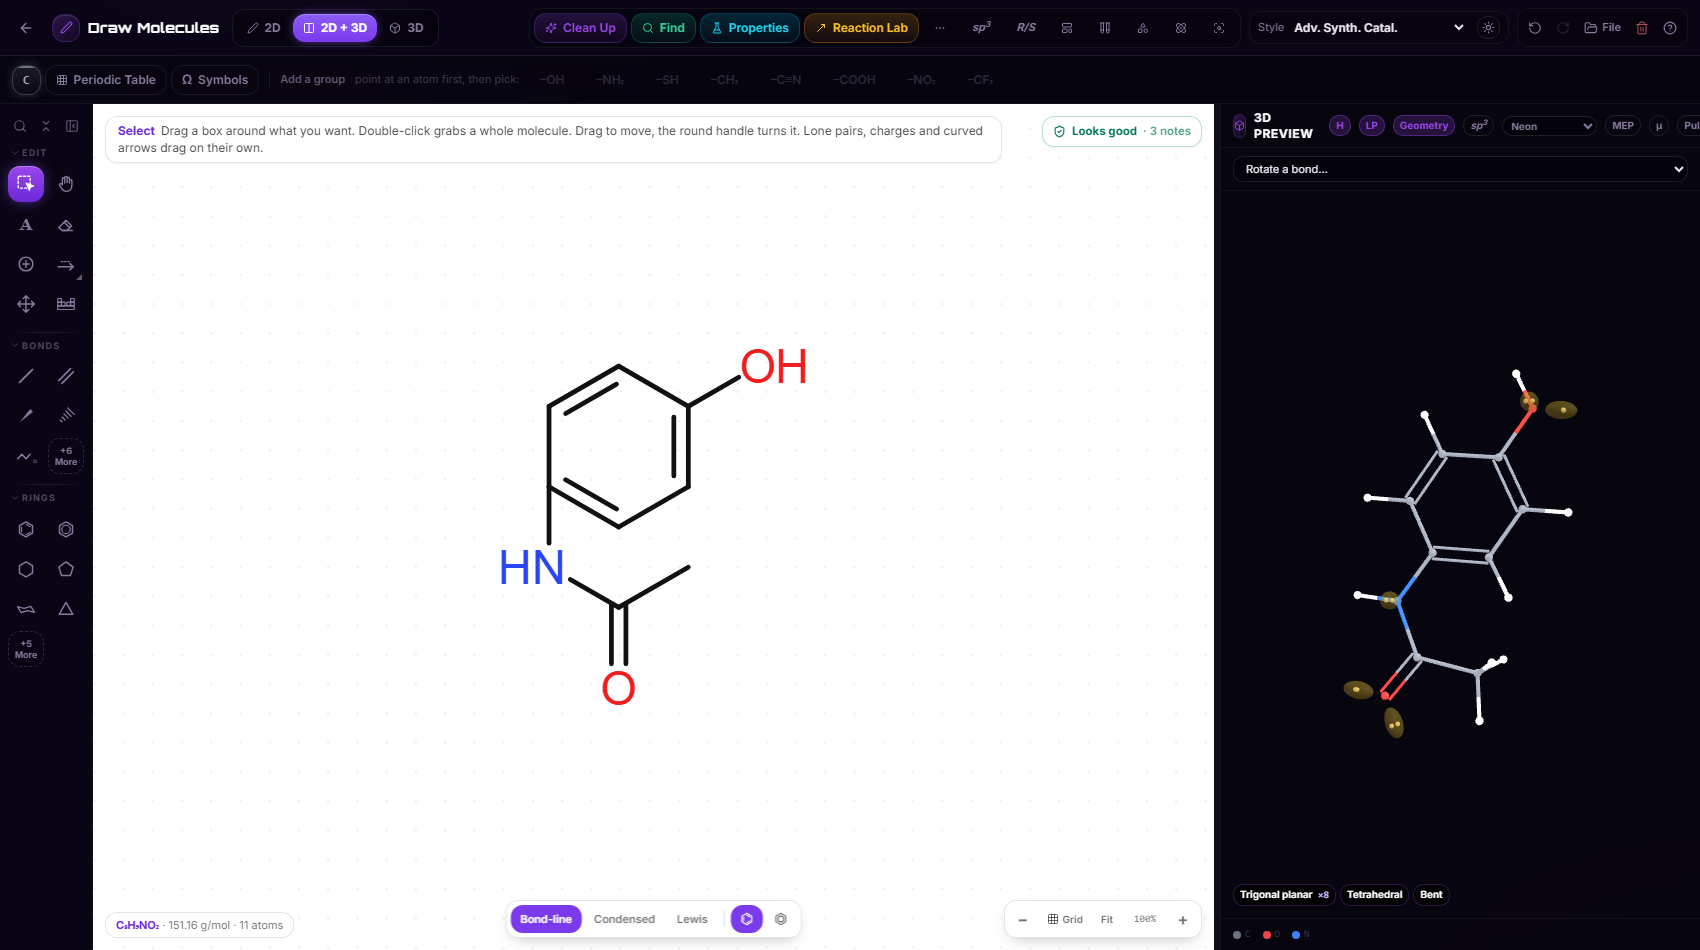
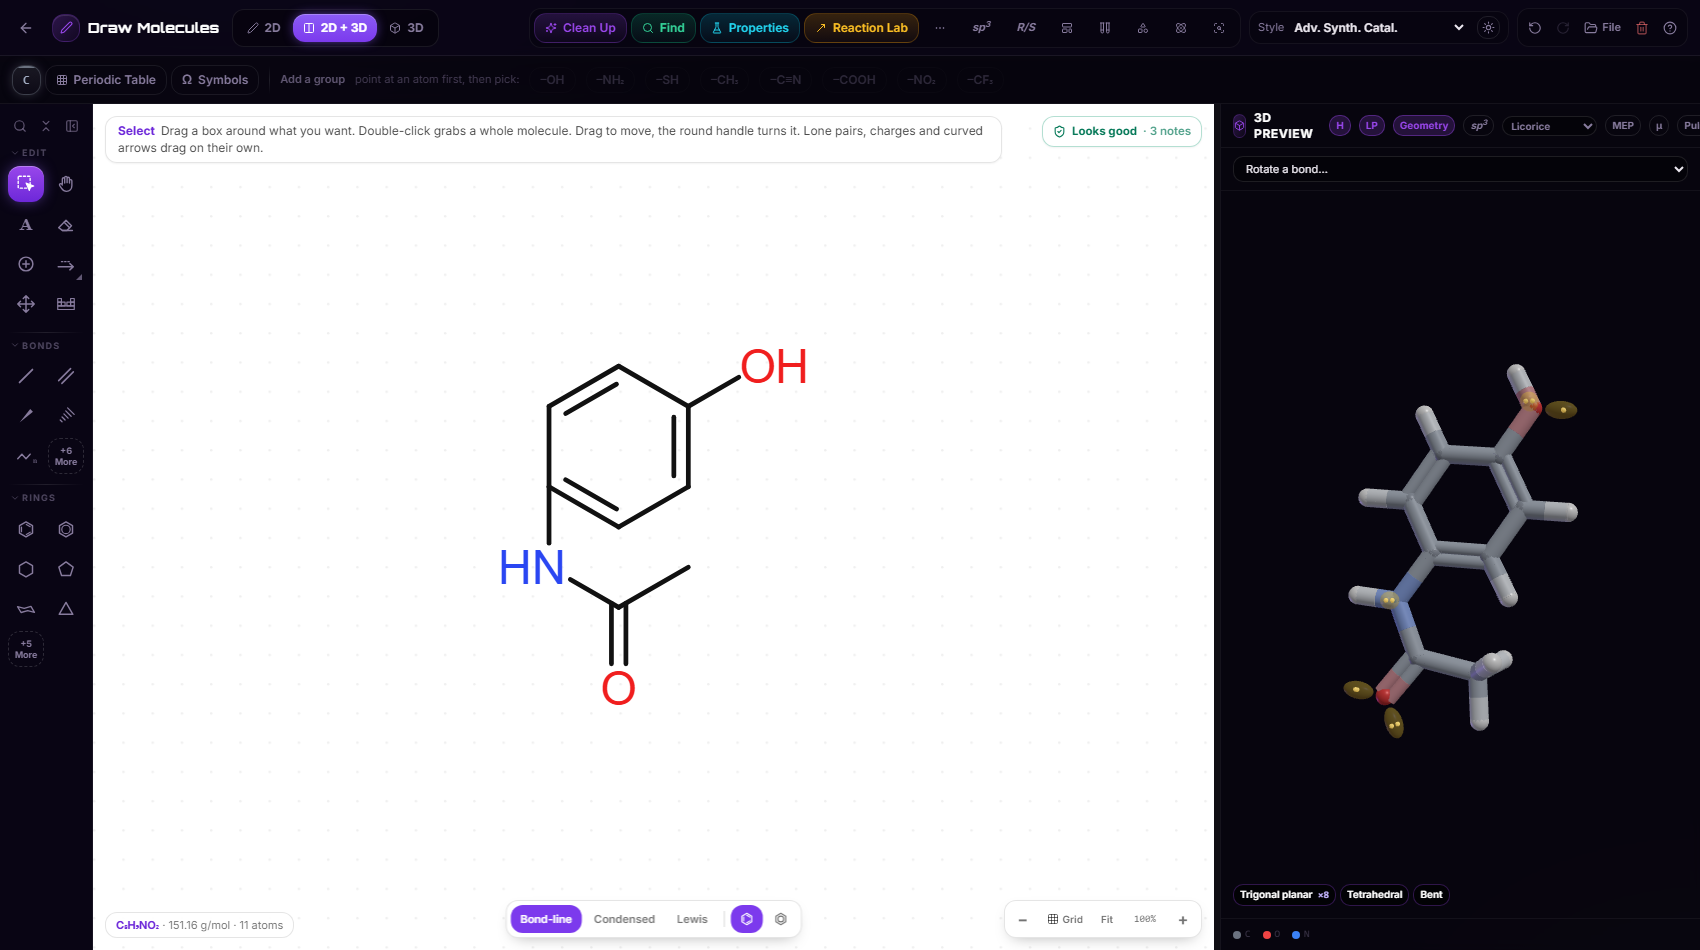
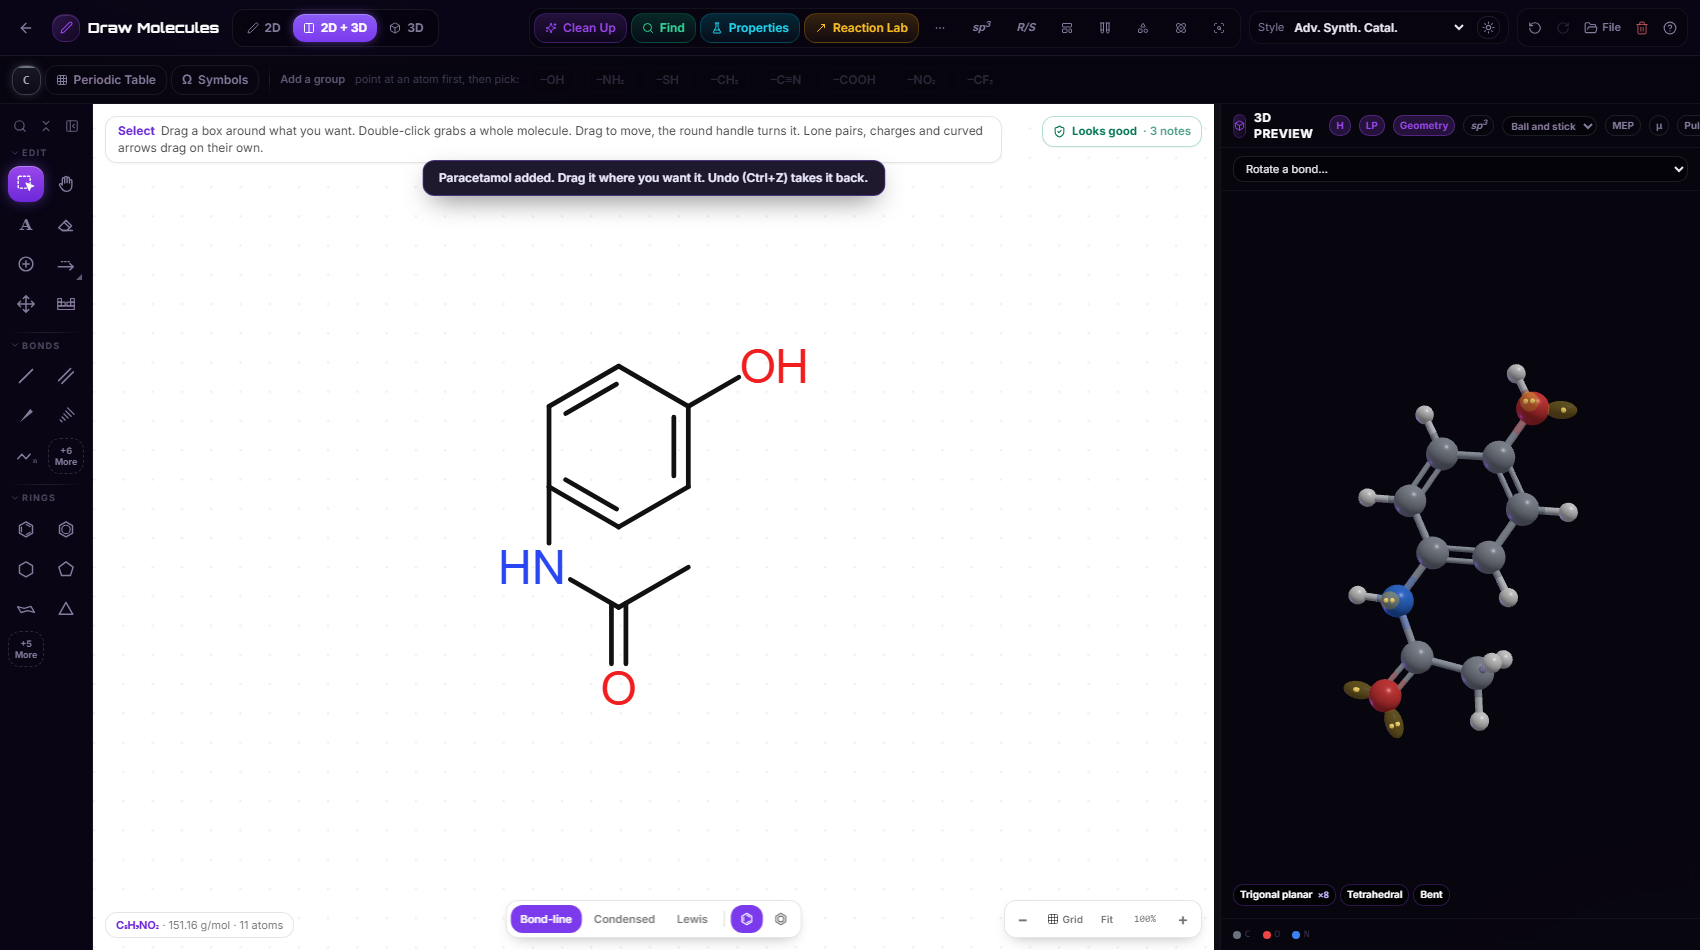
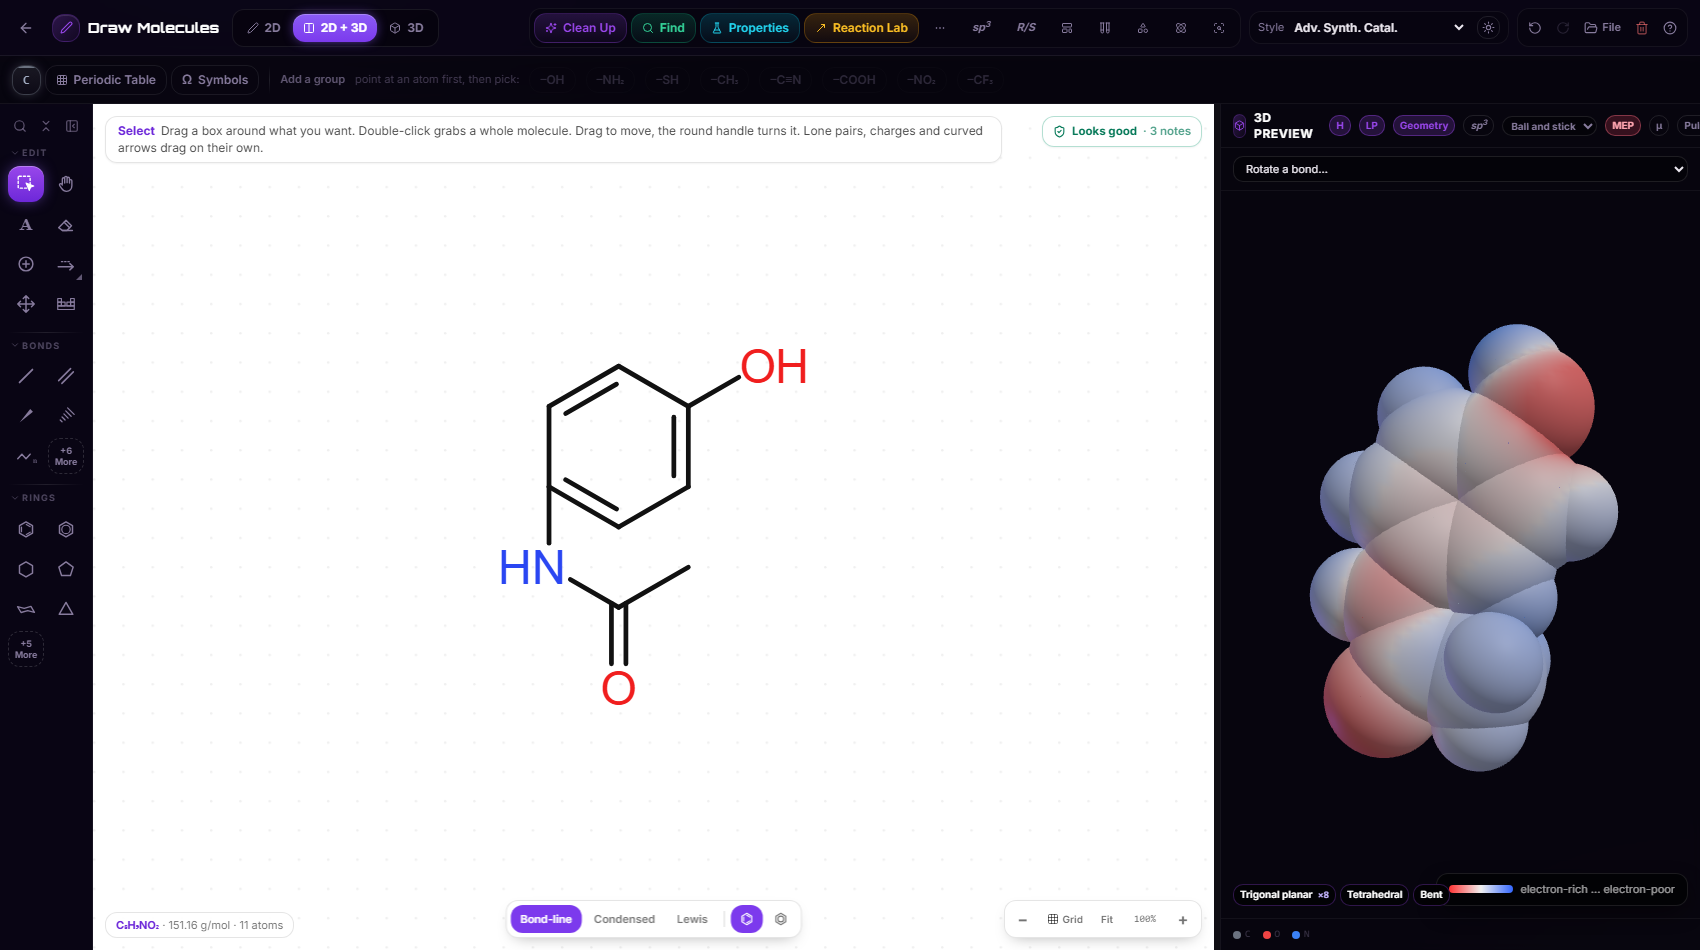
Red where electrons pile up, blue where they are short.
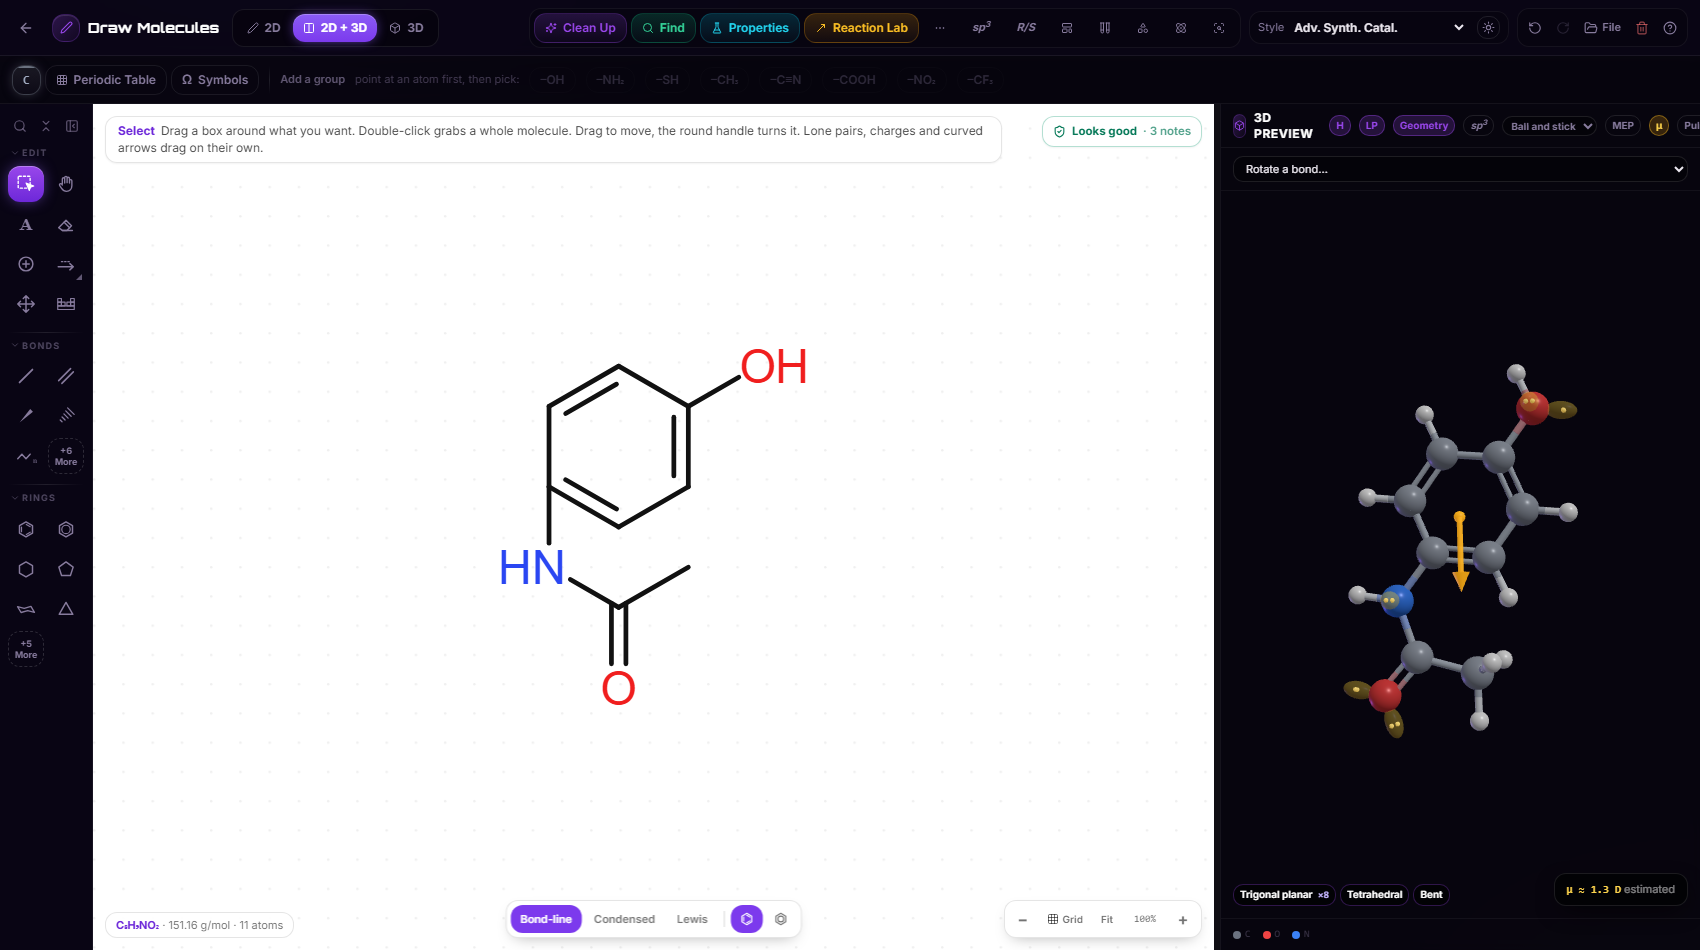
An arrow from the positive to the negative end, with its size in debye.
Molecular Pulse
How the molecule vibrates. Every vibration is a bar in an infrared spectrum (grey bars are the ones the infrared cannot see) and a row in a list. Pick one and the 3D model moves the way that vibration moves it.
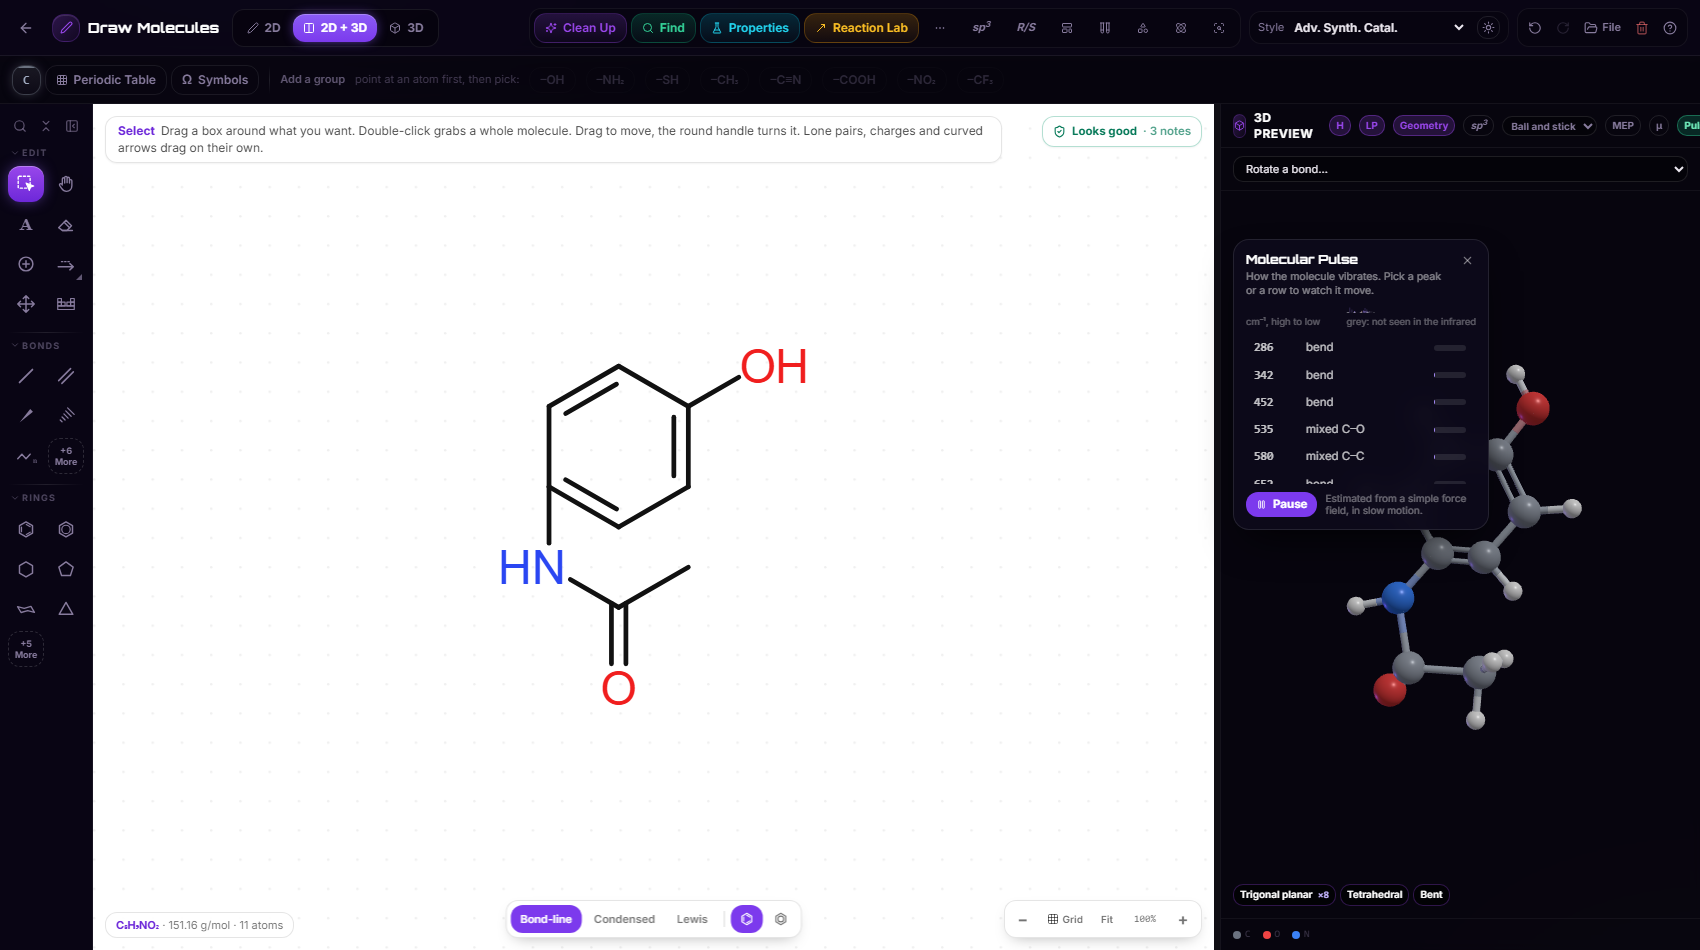
The map, the dipole and the vibrations are classroom estimates, built from electronegativity and a simple force field. The shapes and signs are right, the numbers are close but not exact, and the panels say "estimated" so nobody takes them for quantum results.
Also new
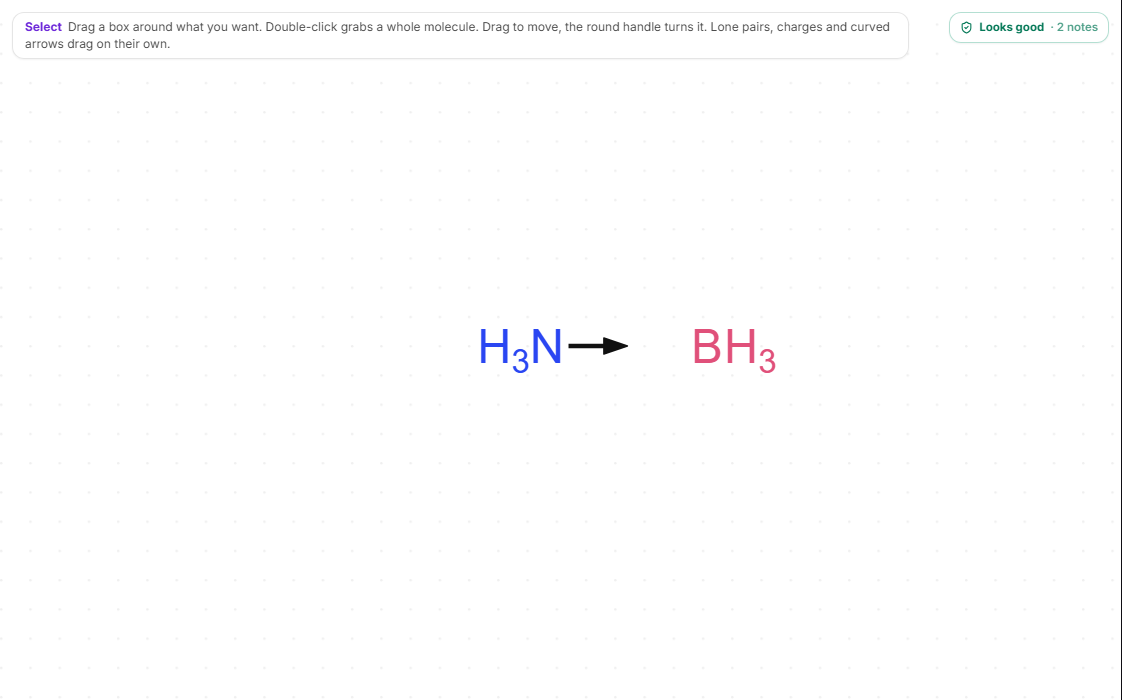
An arrow from the atom that gives both electrons to the one that receives them. It does not count toward valence, so there are no false errors. It is in the bond flyout (More).
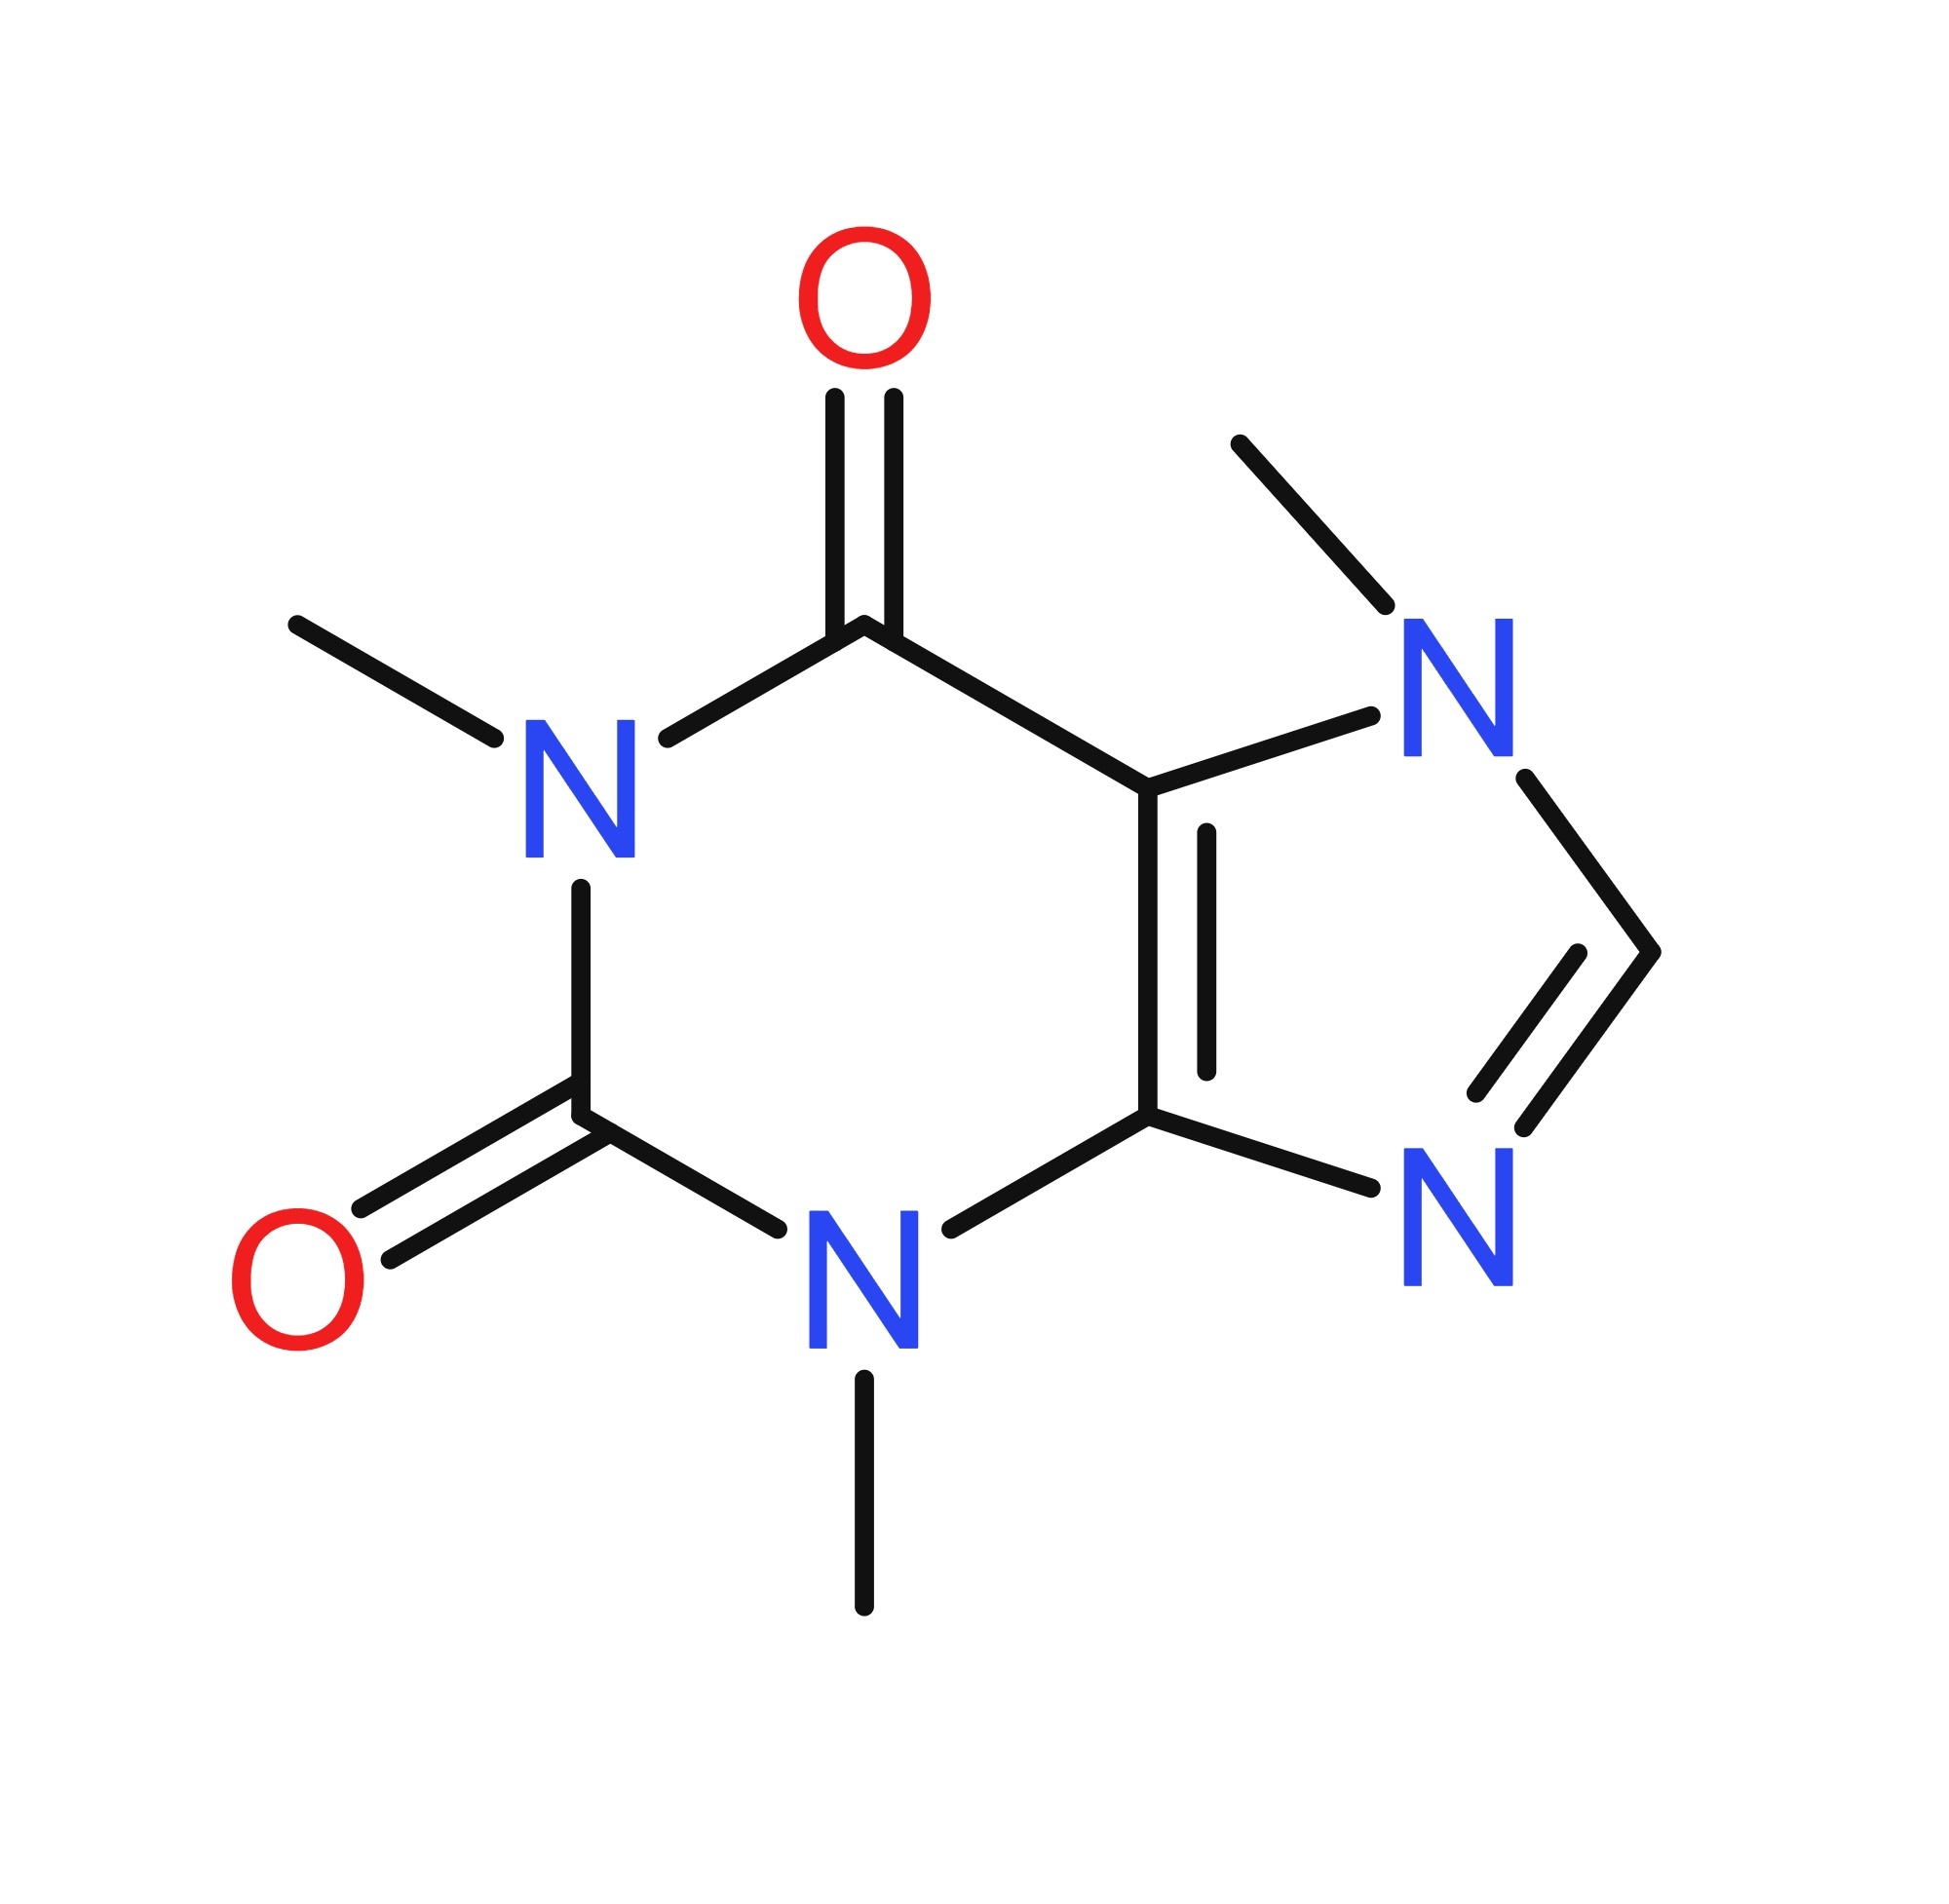
One sharp A4 page, from the File menu or Ctrl+K.
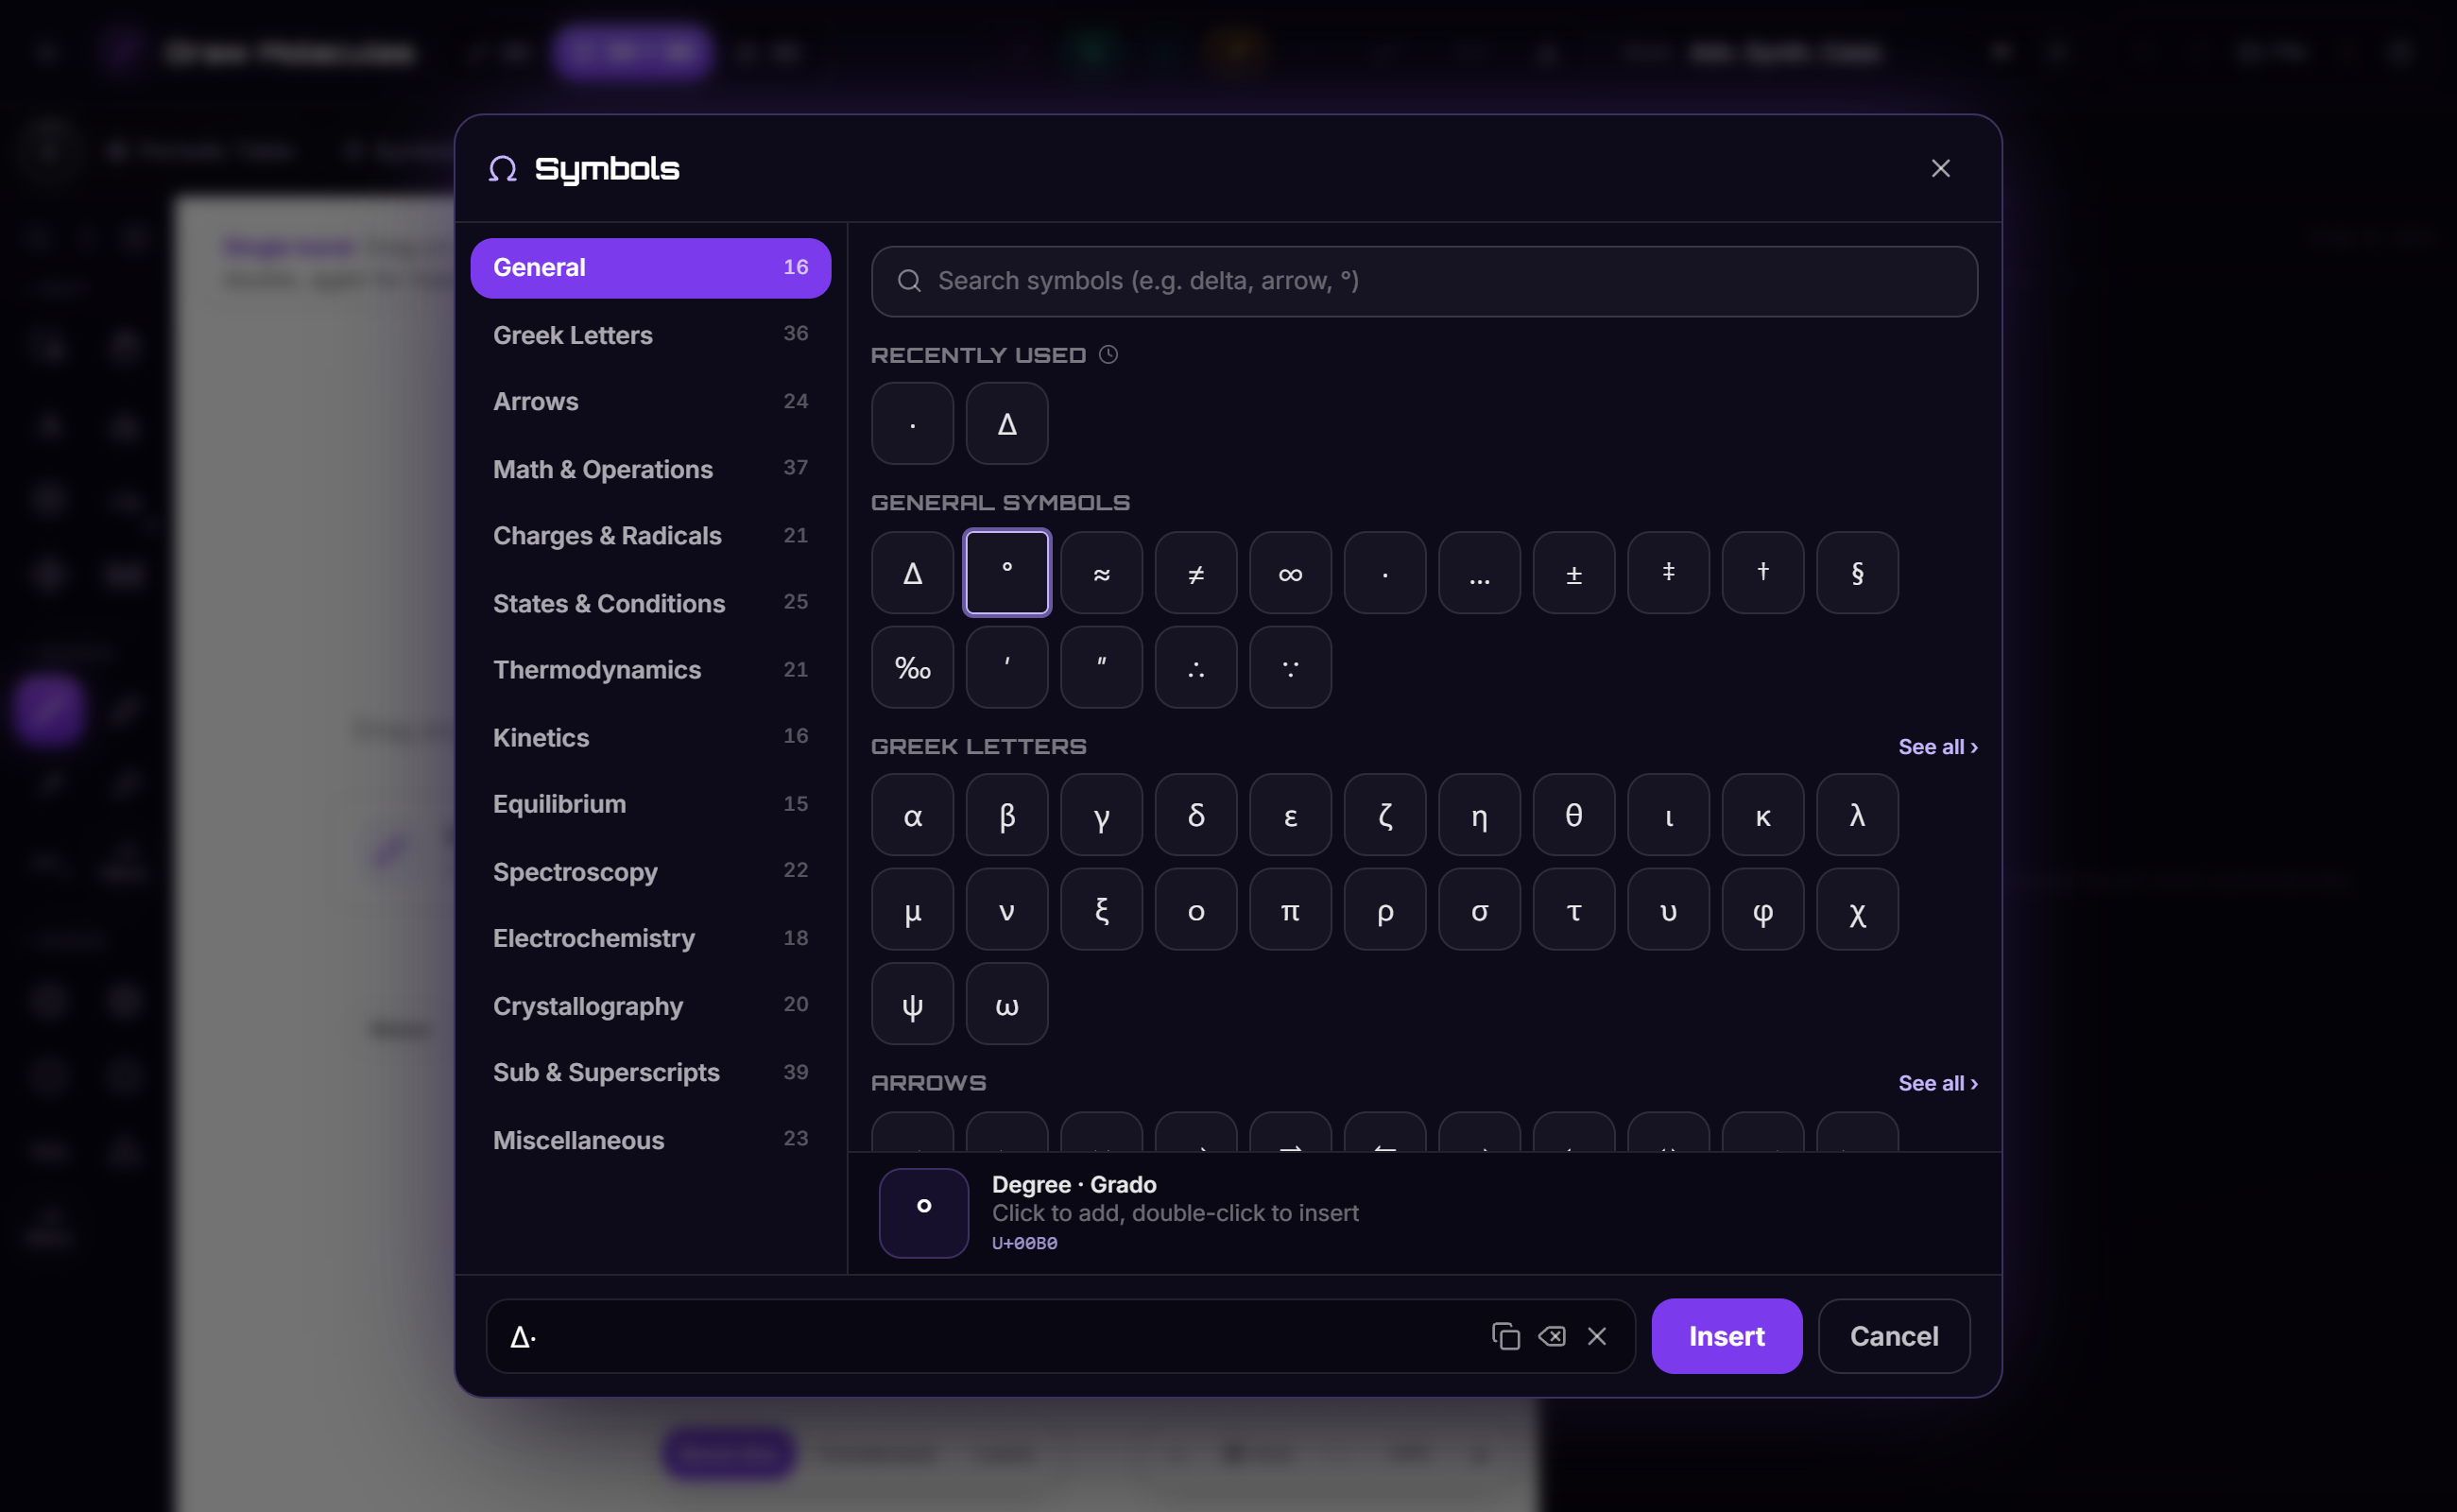
Fixed the charges that drew wrong (²⁺ looked like 2₊) and added recents, a big preview, arrow-key navigation and a tray with copy.
Dragging one molecule in a drawing with 60 rings is much smoother, and the 3D engine now loads only when you open it.
Behind the scenes
- Duels and tournaments now keep score on the server. The questions stay there too and each one is handed out one at a time, so a score cannot be faked from the browser.
- Everything new is translated to Spanish.
What is not in yet, and a few questions
- 3D looks. There are 7 now. I think you had about 22 in mind. Which ones are missing? A screenshot of a few is enough.
- Lag. Where do you feel it: which device, how big a drawing, and doing what (drawing, dragging, 3D)? Dragging a whole huge selection is the only slow case I found, and only on a throttled processor.
- Flame test. I love the idea. Should it live inside each element's card in the periodic table, or be its own lab panel like your mockup?
Not possible honestly in the browser: surface, orbital and electron-density views. They need a real quantum calculation, and a drawing that only looks like data would mislead students.